7905 W Duncan Rd Indian Trail, NC 28079
Estimated payment $2,315/month
About This Lot
Nearly 4 acres available in the desirable Fairview/Piedmont area of Indian Trail! Build your dream home or explore the potential to subdivide. This prime location offers both convenience and privacy—with a Well already on the property
Property Details
Property Type
- Land
Est. Annual Taxes
- $1,050
Year Built
- 1946
Lot Details
- Possible uses of the property include Residential
- Property is zoned AU5
Schools
- Fairview Elementary School
- Piedmont Middle School
- Piedmont High School
Utilities
- Septic Needed
Listing and Financial Details
- Assessor Parcel Number 08-255-006
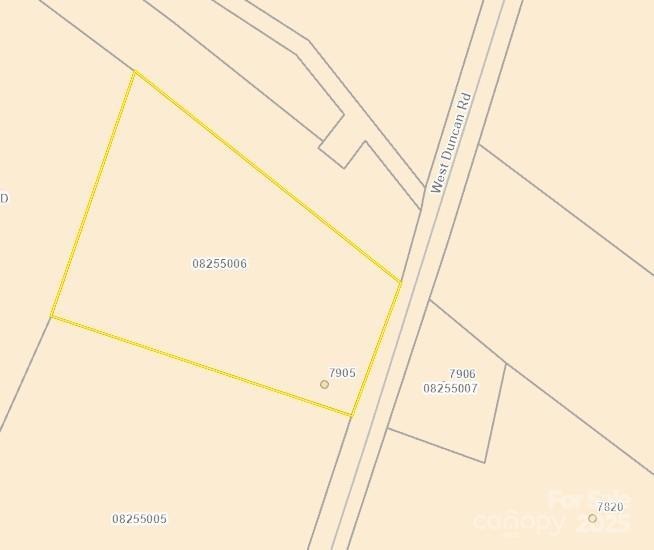
Map
Home Values in the Area
Average Home Value in this Area
Tax History
| Year | Tax Paid | Tax Assessment Tax Assessment Total Assessment is a certain percentage of the fair market value that is determined by local assessors to be the total taxable value of land and additions on the property. | Land | Improvement |
|---|---|---|---|---|
| 2024 | $1,050 | $157,100 | $77,500 | $79,600 |
| 2023 | $1,037 | $157,600 | $78,000 | $79,600 |
| 2022 | $1,037 | $157,600 | $78,000 | $79,600 |
| 2021 | $1,039 | $157,600 | $78,000 | $79,600 |
| 2020 | $876 | $109,200 | $58,000 | $51,200 |
| 2019 | $920 | $109,200 | $58,000 | $51,200 |
| 2018 | $920 | $109,200 | $58,000 | $51,200 |
| 2017 | $975 | $109,200 | $58,000 | $51,200 |
| 2016 | $959 | $109,200 | $58,000 | $51,200 |
| 2015 | $970 | $109,200 | $58,000 | $51,200 |
| 2014 | $917 | $123,680 | $76,000 | $47,680 |
Property History
| Date | Event | Price | Change | Sq Ft Price |
|---|---|---|---|---|
| 04/14/2025 04/14/25 | For Sale | $399,000 | +22.8% | -- |
| 11/16/2023 11/16/23 | Sold | $325,000 | 0.0% | $315 / Sq Ft |
| 09/27/2023 09/27/23 | Price Changed | $325,000 | -7.1% | $315 / Sq Ft |
| 09/08/2023 09/08/23 | For Sale | $350,000 | 0.0% | $339 / Sq Ft |
| 08/29/2023 08/29/23 | Pending | -- | -- | -- |
| 08/29/2023 08/29/23 | For Sale | $350,000 | -- | $339 / Sq Ft |
Deed History
| Date | Type | Sale Price | Title Company |
|---|---|---|---|
| Warranty Deed | $325,000 | None Listed On Document | |
| Warranty Deed | $90,000 | -- |
Source: Canopy MLS (Canopy Realtor® Association)
MLS Number: 4246997
APN: 08-255-006
Disclaimer: Certain information contained herein is derived from information provided by parties other than Homes.com. All information provided is deemed reliable, but is not guaranteed to be accurate and should be independently verified.
![]() Based on information submitted to the MLS GRID. All data is obtained from various sources and may not have been verified by broker or MLS GRID. Supplied Open House Information is subject to change without notice. All information should be independently reviewed and verified for accuracy. Properties may or may not be listed by the office/agent presenting the information. Some IDX listings have been excluded from this website.
Based on information submitted to the MLS GRID. All data is obtained from various sources and may not have been verified by broker or MLS GRID. Supplied Open House Information is subject to change without notice. All information should be independently reviewed and verified for accuracy. Properties may or may not be listed by the office/agent presenting the information. Some IDX listings have been excluded from this website.
The Digital Millennium Copyright Act of 1998, 17 U.S.C. § 512 (the “DMCA”) provides recourse for copyright owners who believe that material appearing on the Internet infringes their rights under U.S. copyright law. If you believe in good faith that any content or material made available in connection with our website or services infringes your copyright, you (or your agent) may send us a notice requesting that the content or material be removed, or access to it blocked.
Notices must be sent in writing by email to DMCAnotice@MLSGrid.com.
The DMCA requires that your notice of alleged copyright infringement include the following information:
(1) description of the copyrighted work that is the subject of claimed infringement;
(2) description of the alleged infringing content and information sufficient to permit us to locate the content;
(3) contact information for you, including your address, telephone number and email address;
(4) a statement by you that you have a good faith belief that the content in the manner complained of is not authorized by the copyright owner, or its agent, or by the operation of any law;
(5) a statement by you, signed under penalty of perjury, that the information in the notification is accurate and that you have the authority to enforce the copyrights that are claimed to be infringed; and
(6) a physical or electronic signature of the copyright owner or a person authorized to act on the copyright owner’s behalf. Failure to include all of the above information may result in the delay of the processing of your complaint.
- 1119 Highway 218 W
- 7504 Surry Ln
- 423 Old Dutch Rd W
- 7005 W Duncan Rd
- 0 Cull Williams Ln
- 00 N Carolina 218
- 112 N Carolina 218
- 9260 Ahavah Ln
- 0 Union Rd Unit CAR4114099
- 1415 Ashe Meadow Dr
- 1855 Rock Hill Church Rd Unit 2
- 5501 Two Iron Dr
- 9414 Machado Dr
- 1865 Rock Hill Church Rd Unit 3
- 000 N Carolina 218
- 00 N Carolina 218
- 1875 Rock Hill Church Rd Unit 4
- 6922 Concord Hwy
- 650 Union Rd
- 6015 Pleasant Run Dr
