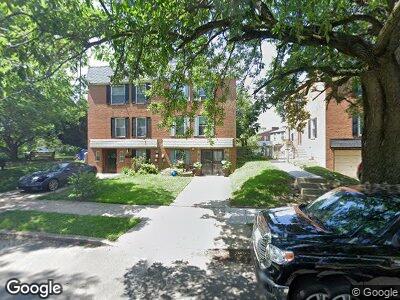
7909 Lindbergh Blvd Philadelphia, PA 19153
Eastwick NeighborhoodEstimated Value: $275,000 - $317,000
--
Bed
--
Bath
1,474
Sq Ft
$196/Sq Ft
Est. Value
About This Home
This home is located at 7909 Lindbergh Blvd, Philadelphia, PA 19153 and is currently estimated at $289,433, approximately $196 per square foot. 7909 Lindbergh Blvd is a home with nearby schools including Penrose School, John Bartram High School, and Philadelphia Montessori Charter School.
Ownership History
Date
Name
Owned For
Owner Type
Purchase Details
Closed on
Feb 27, 2015
Sold by
Huynh Minhtri Q and Tran Diem H
Bought by
Tu Teo V and Tran Hong Tam T
Current Estimated Value
Purchase Details
Closed on
Sep 14, 2007
Sold by
Kone Zakaria
Bought by
Huynh Minhtri Q and Tran Diem H
Home Financials for this Owner
Home Financials are based on the most recent Mortgage that was taken out on this home.
Original Mortgage
$168,300
Outstanding Balance
$109,105
Interest Rate
6.51%
Mortgage Type
Purchase Money Mortgage
Purchase Details
Closed on
May 27, 2005
Sold by
Staley Tina Louise
Bought by
Kone Zakaria
Home Financials for this Owner
Home Financials are based on the most recent Mortgage that was taken out on this home.
Original Mortgage
$154,160
Interest Rate
5.83%
Mortgage Type
Fannie Mae Freddie Mac
Purchase Details
Closed on
Jun 20, 1997
Sold by
Errera Mary R
Bought by
Staley Tina Louise
Create a Home Valuation Report for This Property
The Home Valuation Report is an in-depth analysis detailing your home's value as well as a comparison with similar homes in the area
Home Values in the Area
Average Home Value in this Area
Purchase History
| Date | Buyer | Sale Price | Title Company |
|---|---|---|---|
| Tu Teo V | -- | None Available | |
| Huynh Minhtri Q | $187,000 | None Available | |
| Kone Zakaria | $164,000 | Fidelity Natl Title Ins Co | |
| Staley Tina Louise | $72,000 | T A Title Insurance Co |
Source: Public Records
Mortgage History
| Date | Status | Borrower | Loan Amount |
|---|---|---|---|
| Open | Huynh Minhtri Q | $168,300 | |
| Previous Owner | Kone Zakaria | $154,160 |
Source: Public Records
Tax History Compared to Growth
Tax History
| Year | Tax Paid | Tax Assessment Tax Assessment Total Assessment is a certain percentage of the fair market value that is determined by local assessors to be the total taxable value of land and additions on the property. | Land | Improvement |
|---|---|---|---|---|
| 2025 | $3,500 | $268,900 | $53,700 | $215,200 |
| 2024 | $3,500 | $268,900 | $53,700 | $215,200 |
| 2023 | $3,500 | $250,000 | $50,000 | $200,000 |
| 2022 | $2,598 | $250,000 | $50,000 | $200,000 |
| 2021 | $2,598 | $0 | $0 | $0 |
| 2020 | $2,598 | $0 | $0 | $0 |
| 2019 | $2,396 | $0 | $0 | $0 |
| 2018 | $2,038 | $0 | $0 | $0 |
| 2017 | $2,038 | $0 | $0 | $0 |
| 2016 | $2,038 | $0 | $0 | $0 |
| 2015 | $1,951 | $0 | $0 | $0 |
| 2014 | -- | $145,600 | $31,500 | $114,100 |
| 2012 | -- | $20,256 | $2,250 | $18,006 |
Source: Public Records
Map
Nearby Homes
- 2708 Phillips Terrace
- 8029 Lindbergh Blvd
- 7929 Buist Ave
- 7909 Buist Ave
- 8101 Titan Place
- 8027 Brunswick Ave
- 7831 Venus Place
- 8116 Angelo Place
- 7611 Raven Place
- 7627 Este Ave
- 7627 Elmwood Ave
- 7522 Wheeler St
- 2600 Island Ave
- 7533 Wheeler St
- 526 S 3rd St
- 2419 S Claymont St
- 7441 Elmwood Ave
- 7307 Kinglet Place
- 7368 Wheeler St
- 7215 Guyer Ave