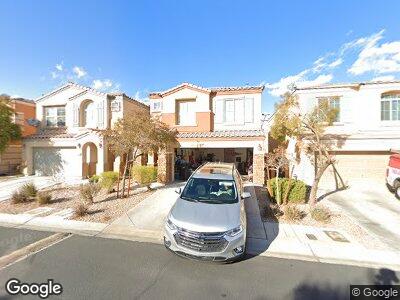
7932 Capistrano Valley Ave Las Vegas, NV 89178
Mountains Edge NeighborhoodEstimated Value: $428,000 - $449,000
4
Beds
3
Baths
1,686
Sq Ft
$258/Sq Ft
Est. Value
About This Home
This home is located at 7932 Capistrano Valley Ave, Las Vegas, NV 89178 and is currently estimated at $435,609, approximately $258 per square foot. 7932 Capistrano Valley Ave is a home located in Clark County with nearby schools including Carolyn S. Reedom Elementary School, Desert Oasis High School, and Doral Academy Cactus.
Ownership History
Date
Name
Owned For
Owner Type
Purchase Details
Closed on
Nov 11, 2011
Sold by
Lacson Ronmithz A and Reyes Lacson Genesis A
Bought by
Gonzalez Erika and Alvarez Christian
Current Estimated Value
Home Financials for this Owner
Home Financials are based on the most recent Mortgage that was taken out on this home.
Original Mortgage
$116,470
Interest Rate
4.25%
Mortgage Type
FHA
Purchase Details
Closed on
Apr 2, 2008
Sold by
Woodside Rio Vista Llc
Bought by
Lacson Ronmithz A and Reyes Lacson Genesis A
Home Financials for this Owner
Home Financials are based on the most recent Mortgage that was taken out on this home.
Original Mortgage
$234,900
Interest Rate
6.04%
Mortgage Type
VA
Create a Home Valuation Report for This Property
The Home Valuation Report is an in-depth analysis detailing your home's value as well as a comparison with similar homes in the area
Home Values in the Area
Average Home Value in this Area
Purchase History
| Date | Buyer | Sale Price | Title Company |
|---|---|---|---|
| Gonzalez Erika | $119,500 | Ticor Title Las Vegas | |
| Lacson Ronmithz A | $230,000 | Chicago Title |
Source: Public Records
Mortgage History
| Date | Status | Borrower | Loan Amount |
|---|---|---|---|
| Open | Alvarez Erika | $185,100 | |
| Closed | Gonzalez Erika | $187,000 | |
| Closed | Gonzalez Erika | $116,470 | |
| Previous Owner | Lacson Ronmithz A | $242,607 | |
| Previous Owner | Lacson Ronmithz A | $234,900 |
Source: Public Records
Tax History Compared to Growth
Tax History
| Year | Tax Paid | Tax Assessment Tax Assessment Total Assessment is a certain percentage of the fair market value that is determined by local assessors to be the total taxable value of land and additions on the property. | Land | Improvement |
|---|---|---|---|---|
| 2025 | $1,594 | $113,374 | $35,000 | $78,374 |
| 2024 | $1,548 | $113,374 | $35,000 | $78,374 |
| 2023 | $1,548 | $105,030 | $31,500 | $73,530 |
| 2022 | $1,503 | $93,465 | $26,250 | $67,215 |
| 2021 | $1,459 | $88,350 | $24,500 | $63,850 |
| 2020 | $1,414 | $86,558 | $23,450 | $63,108 |
| 2019 | $1,373 | $82,833 | $21,000 | $61,833 |
| 2018 | $1,333 | $75,610 | $16,450 | $59,160 |
| 2017 | $2,057 | $70,132 | $15,050 | $55,082 |
| 2016 | $1,263 | $61,009 | $11,550 | $49,459 |
| 2015 | $1,260 | $57,747 | $9,100 | $48,647 |
| 2014 | $1,223 | $40,570 | $5,600 | $34,970 |
Source: Public Records
Map
Nearby Homes
- 7931 Campers Village Ave
- 7961 Alta Lima Valley Ct
- 9893 Cove Haven Ct
- 10051 Sand Key St
- 10067 Sand Key St
- 7978 Pomona Valley Ct
- 9996 Sable Point St
- 10091 Sand Key St
- 8058 Torremolinos Ave
- 8005 Egypt Meadows Ave
- 10081 Peak Lookout St
- 10008 Peak Lookout St
- 8170 Base Camp Ave
- 8156 Cheerful Valley Ave
- 8070 Pavarotti Ave
- 9622 Staff Ln
- 9611 Trattoria St
- 10001 Blairwood Ct
- 7943 Sleeping Lily Dr
- 7763 Brisk Ocean Ave