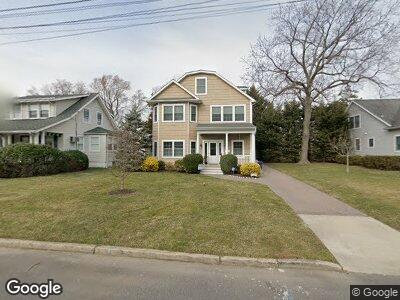
804 Central Ave Spring Lake, NJ 07762
Spring Lake Heights NeighborhoodEstimated Value: $1,126,000 - $1,548,476
4
Beds
2
Baths
2,712
Sq Ft
$479/Sq Ft
Est. Value
About This Home
This home is located at 804 Central Ave, Spring Lake, NJ 07762 and is currently estimated at $1,298,619, approximately $478 per square foot. 804 Central Ave is a home located in Monmouth County with nearby schools including Spring Lake Heights Elementary School, The Brookside School, and St. Catharine School.
Ownership History
Date
Name
Owned For
Owner Type
Purchase Details
Closed on
Jun 3, 2008
Sold by
Madden Sherry E and Ellsworth Marilyn Madden
Bought by
Clark Brian and Clark Leah E
Current Estimated Value
Home Financials for this Owner
Home Financials are based on the most recent Mortgage that was taken out on this home.
Original Mortgage
$225,000
Interest Rate
6.07%
Mortgage Type
Purchase Money Mortgage
Purchase Details
Closed on
Nov 6, 2007
Sold by
Ellsworth Marilyn Madden
Bought by
Ellsworth Marilyn Madden and Madden Sherry E
Create a Home Valuation Report for This Property
The Home Valuation Report is an in-depth analysis detailing your home's value as well as a comparison with similar homes in the area
Home Values in the Area
Average Home Value in this Area
Purchase History
| Date | Buyer | Sale Price | Title Company |
|---|---|---|---|
| Clark Brian | $375,000 | Fidelity Natl Title Ins Co | |
| Ellsworth Marilyn Madden | -- | None Available |
Source: Public Records
Mortgage History
| Date | Status | Borrower | Loan Amount |
|---|---|---|---|
| Open | Clark Brian | $150,000 | |
| Open | Clark Leah E | $300,000 | |
| Closed | Clark Brian | $225,000 |
Source: Public Records
Tax History Compared to Growth
Tax History
| Year | Tax Paid | Tax Assessment Tax Assessment Total Assessment is a certain percentage of the fair market value that is determined by local assessors to be the total taxable value of land and additions on the property. | Land | Improvement |
|---|---|---|---|---|
| 2024 | $11,798 | $1,160,500 | $612,900 | $547,600 |
| 2023 | $11,798 | $1,053,400 | $513,000 | $540,400 |
| 2022 | $10,611 | $873,900 | $359,600 | $514,300 |
| 2021 | $9,850 | $786,000 | $313,200 | $472,800 |
| 2020 | $9,852 | $725,500 | $291,600 | $433,900 |
| 2019 | $9,850 | $717,900 | $291,600 | $426,300 |
| 2018 | $9,728 | $689,900 | $291,600 | $398,300 |
| 2017 | $9,372 | $689,100 | $291,600 | $397,500 |
| 2016 | $9,583 | $695,900 | $291,600 | $404,300 |
| 2015 | $9,467 | $689,500 | $291,600 | $397,900 |
| 2014 | $9,042 | $673,300 | $270,000 | $403,300 |
Source: Public Records
Map
Nearby Homes