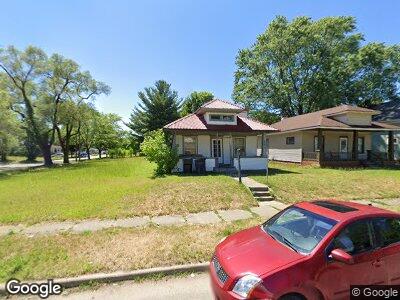
805 Johnson St South Bend, IN 46628
Kennedy Park NeighborhoodEstimated Value: $99,000 - $108,000
3
Beds
1
Bath
2,340
Sq Ft
$45/Sq Ft
Est. Value
About This Home
This home is located at 805 Johnson St, South Bend, IN 46628 and is currently estimated at $104,224, approximately $44 per square foot. 805 Johnson St is a home located in St. Joseph County with nearby schools including Harrison Elementary School, Dickinson Fine Arts Academy, and Washington High School.
Ownership History
Date
Name
Owned For
Owner Type
Purchase Details
Closed on
Aug 30, 2023
Sold by
Aguilar-Cardoso Minerva
Bought by
Calero Crisoforo A and Aguilar-Cardoso Minerva
Current Estimated Value
Purchase Details
Closed on
May 10, 2021
Sold by
Navarro Juan F
Bought by
Cardoso Minerva Aguilar
Purchase Details
Closed on
Oct 18, 2018
Sold by
Rivera Karla J
Bought by
Nabarro Juan F
Purchase Details
Closed on
Dec 5, 2012
Sold by
Mellado Rodrigo Vazquez
Bought by
Rivera Karla J
Purchase Details
Closed on
Sep 9, 2012
Sold by
Peter H Mullen St Joseph County Auditor
Bought by
Rodrigo Vazquezmellado
Purchase Details
Closed on
Aug 14, 2012
Sold by
Esther Wilkeson
Bought by
Mellado Rodrigo Vazquez
Purchase Details
Closed on
Jun 3, 2005
Sold by
Abrajan Diego S and Abrajan Ida L
Bought by
Wilkeson Esther
Home Financials for this Owner
Home Financials are based on the most recent Mortgage that was taken out on this home.
Original Mortgage
$45,600
Interest Rate
1%
Mortgage Type
Adjustable Rate Mortgage/ARM
Create a Home Valuation Report for This Property
The Home Valuation Report is an in-depth analysis detailing your home's value as well as a comparison with similar homes in the area
Home Values in the Area
Average Home Value in this Area
Purchase History
| Date | Buyer | Sale Price | Title Company |
|---|---|---|---|
| Calero Crisoforo A | -- | None Listed On Document | |
| Cardoso Minerva Aguilar | $19,000 | Fidelity National Title | |
| Nabarro Juan F | -- | None Available | |
| Rivera Karla J | -- | None Available | |
| Rodrigo Vazquezmellado | $500 | -- | |
| Mellado Rodrigo Vazquez | $465 | None Available | |
| Wilkeson Esther | -- | None Available |
Source: Public Records
Mortgage History
| Date | Status | Borrower | Loan Amount |
|---|---|---|---|
| Previous Owner | Wilkeson Esther | $45,600 |
Source: Public Records
Tax History Compared to Growth
Tax History
| Year | Tax Paid | Tax Assessment Tax Assessment Total Assessment is a certain percentage of the fair market value that is determined by local assessors to be the total taxable value of land and additions on the property. | Land | Improvement |
|---|---|---|---|---|
| 2024 | $1,540 | $62,800 | $4,000 | $58,800 |
| 2023 | $1,349 | $62,800 | $4,000 | $58,800 |
| 2022 | $1,349 | $56,200 | $4,000 | $52,200 |
| 2021 | $607 | $51,100 | $3,500 | $47,600 |
| 2020 | $638 | $53,900 | $3,700 | $50,200 |
| 2019 | $448 | $40,500 | $2,800 | $37,700 |
| 2018 | $714 | $28,100 | $2,400 | $25,700 |
| 2017 | $734 | $27,800 | $2,400 | $25,400 |
| 2016 | $750 | $38,300 | $2,400 | $35,900 |
| 2014 | $991 | $37,900 | $2,400 | $35,500 |
Source: Public Records
Map
Nearby Homes
- 2020 Prast Blvd
- 727 Johnson St
- 809 O Brien St
- 801 O Brien St
- 705 N Johnson St
- 634 N Johnson St
- 905 N Adams St
- 829 N Elmer St
- 1801 Longley Ave
- 1043 Johnson St
- 802 N Olive St
- 2105 Roger St
- 2121 Roger St
- 1031 College St
- 642 O Brien St
- 625 O Brien St
- 1646 O Brien St
- 1805 Fassnacht Ave
- 1632 Longley Ave
- 1050 N Elmer St