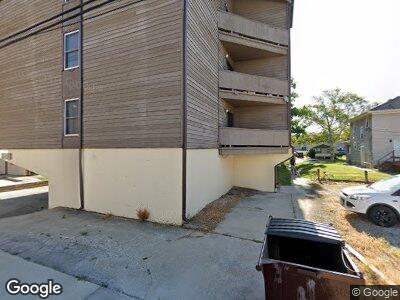
807 S Locust St Champaign, IL 61820
Campustown NeighborhoodEstimated Value: $1,833,942 - $2,148,000
4
Beds
--
Bath
--
Sq Ft
8,886
Sq Ft Lot
About This Home
This home is located at 807 S Locust St, Champaign, IL 61820 and is currently estimated at $1,990,971. 807 S Locust St is a home located in Champaign County with nearby schools including Central High School and Holy Cross Elementary School.
Ownership History
Date
Name
Owned For
Owner Type
Purchase Details
Closed on
Sep 27, 2023
Sold by
Bg Enterprises Ii Llc and Dcb Mansions Llc
Bought by
Mci Propco 7 Llc
Current Estimated Value
Purchase Details
Closed on
Jul 15, 2016
Sold by
Campus Investments Llc
Bought by
Dcb Mansions Llc
Home Financials for this Owner
Home Financials are based on the most recent Mortgage that was taken out on this home.
Original Mortgage
$1,250,000
Interest Rate
3.54%
Mortgage Type
Commercial
Purchase Details
Closed on
Nov 30, 2012
Sold by
Johnson Kenneth E and Johnson Betty J
Bought by
Campus Investments Llc
Home Financials for this Owner
Home Financials are based on the most recent Mortgage that was taken out on this home.
Original Mortgage
$14,391,440
Interest Rate
3.38%
Mortgage Type
Future Advance Clause Open End Mortgage
Create a Home Valuation Report for This Property
The Home Valuation Report is an in-depth analysis detailing your home's value as well as a comparison with similar homes in the area
Home Values in the Area
Average Home Value in this Area
Purchase History
| Date | Buyer | Sale Price | Title Company |
|---|---|---|---|
| Mci Propco 7 Llc | $10,494,500 | None Listed On Document | |
| Dcb Mansions Llc | $1,250,000 | None Available | |
| Campus Investments Llc | $17,984,000 | None Available |
Source: Public Records
Mortgage History
| Date | Status | Borrower | Loan Amount |
|---|---|---|---|
| Previous Owner | Dcb Mansisons Llc | $1,095,444 | |
| Previous Owner | Dcb Mansions Llc | $1,250,000 | |
| Previous Owner | Campus Investments Llc | $17,184,338 | |
| Previous Owner | Campus Investments Llc | $14,391,440 | |
| Previous Owner | Campus Investments Llc | $14,391 |
Source: Public Records
Tax History Compared to Growth
Tax History
| Year | Tax Paid | Tax Assessment Tax Assessment Total Assessment is a certain percentage of the fair market value that is determined by local assessors to be the total taxable value of land and additions on the property. | Land | Improvement |
|---|---|---|---|---|
| 2023 | $39,511 | $438,140 | $117,330 | $320,810 |
| 2022 | $37,169 | $404,190 | $108,240 | $295,950 |
| 2021 | $34,223 | $373,840 | $100,110 | $273,730 |
| 2020 | $32,643 | $356,030 | $95,340 | $260,690 |
| 2019 | $31,594 | $348,710 | $93,380 | $255,330 |
| 2018 | $30,885 | $343,220 | $91,910 | $251,310 |
| 2017 | $31,013 | $343,220 | $91,910 | $251,310 |
| 2016 | $27,806 | $336,160 | $90,020 | $246,140 |
| 2015 | $23,729 | $330,220 | $88,430 | $241,790 |
| 2014 | $23,526 | $279,660 | $37,870 | $241,790 |
| 2013 | $23,315 | $279,660 | $37,870 | $241,790 |
Source: Public Records
Map
Nearby Homes
- 212 W John St
- 200 Buena Vista Dr
- 506 W Green St
- 508 W Green St
- 301 N Neil St Unit 611
- 301 N Neil St Unit 604
- 301 N Neil St Unit 808-809
- 602 Hessel Blvd
- 615 W Union St
- 503 E Park St
- 612 W Clark St
- 805 W Charles St
- 506 E Church St
- 508 E Church St
- 707 W White St
- 408 N Prairie St Unit 9
- 703 Hamilton Dr
- 706 Fairway Dr
- 507 E Washington St
- 311 W Columbia Ave