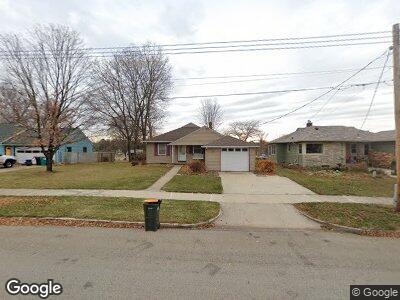
808 9 1/2 St NE Rochester, MN 55906
Quarry Hill West NeighborhoodEstimated Value: $244,000 - $303,000
2
Beds
2
Baths
1,152
Sq Ft
$230/Sq Ft
Est. Value
About This Home
This home is located at 808 9 1/2 St NE, Rochester, MN 55906 and is currently estimated at $265,227, approximately $230 per square foot. 808 9 1/2 St NE is a home located in Olmsted County with nearby schools including Jefferson Elementary School, Kellogg Middle School, and Century Senior High School.
Create a Home Valuation Report for This Property
The Home Valuation Report is an in-depth analysis detailing your home's value as well as a comparison with similar homes in the area
Home Values in the Area
Average Home Value in this Area
Tax History Compared to Growth
Tax History
| Year | Tax Paid | Tax Assessment Tax Assessment Total Assessment is a certain percentage of the fair market value that is determined by local assessors to be the total taxable value of land and additions on the property. | Land | Improvement |
|---|---|---|---|---|
| 2023 | $2,994 | $250,400 | $70,000 | $180,400 |
| 2022 | $2,890 | $239,300 | $70,000 | $169,300 |
| 2021 | $2,464 | $224,700 | $50,000 | $174,700 |
| 2020 | $2,428 | $195,500 | $32,000 | $163,500 |
| 2019 | $2,188 | $186,600 | $32,000 | $154,600 |
| 2018 | $1,805 | $171,500 | $32,000 | $139,500 |
| 2017 | $1,656 | $155,500 | $32,000 | $123,500 |
| 2016 | $1,734 | $109,400 | $17,600 | $91,800 |
| 2015 | $1,620 | $112,700 | $17,700 | $95,000 |
| 2014 | $1,616 | $112,900 | $17,700 | $95,200 |
| 2012 | -- | $115,000 | $17,781 | $97,219 |
Source: Public Records
Map
Nearby Homes
- 939 9th Ave NE
- 912 7th Ave NE
- 903 10th Ave NE
- 914 10th Ave NE
- 1101 8th Ave NE
- 956 11th Ave NE
- 801 14th St NE
- 1409 8th Ave NE
- 804 13th Ave NE
- 407 14th St NE
- 1308 7th St NE
- 1401 10th St NE
- 711 15th Ave NE
- 1417 12th St NE
- 207 14th St NE
- 306 10th Ave NE
- 1505 7th St NE
- 716 16th Ave NE
- 1701 10th St NE
- 1312 2nd St NE