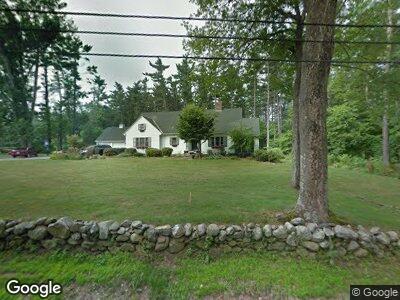
81 Malden St West Boylston, MA 01583
Outlying West Boylston NeighborhoodEstimated Value: $750,649 - $1,162,000
3
Beds
3
Baths
2,911
Sq Ft
$302/Sq Ft
Est. Value
About This Home
This home is located at 81 Malden St, West Boylston, MA 01583 and is currently estimated at $878,412, approximately $301 per square foot. 81 Malden St is a home located in Worcester County with nearby schools including Major Edwards Elementary School and West Boylston Junior/Senior High School.
Ownership History
Date
Name
Owned For
Owner Type
Purchase Details
Closed on
Oct 3, 1995
Sold by
Marsden Philip and Marsden Joyce
Bought by
Gallagher F Edward and Gallagher Johanna
Current Estimated Value
Home Financials for this Owner
Home Financials are based on the most recent Mortgage that was taken out on this home.
Original Mortgage
$235,000
Interest Rate
7.89%
Mortgage Type
Purchase Money Mortgage
Purchase Details
Closed on
Dec 11, 1989
Sold by
Christopherson Phil
Bought by
Marsden Philip
Home Financials for this Owner
Home Financials are based on the most recent Mortgage that was taken out on this home.
Original Mortgage
$230,000
Interest Rate
9.72%
Mortgage Type
Purchase Money Mortgage
Purchase Details
Closed on
Jun 4, 1987
Sold by
Cook Sandra T
Bought by
Christopherson P
Create a Home Valuation Report for This Property
The Home Valuation Report is an in-depth analysis detailing your home's value as well as a comparison with similar homes in the area
Home Values in the Area
Average Home Value in this Area
Purchase History
| Date | Buyer | Sale Price | Title Company |
|---|---|---|---|
| Gallagher F Edward | $295,000 | -- | |
| Marsden Philip | $325,000 | -- | |
| Christopherson P | $420,000 | -- |
Source: Public Records
Mortgage History
| Date | Status | Borrower | Loan Amount |
|---|---|---|---|
| Open | Christopherson P | $315,000 | |
| Closed | Christopherson P | $227,000 | |
| Closed | Christopherson P | $235,000 | |
| Previous Owner | Christopherson P | $230,000 |
Source: Public Records
Tax History Compared to Growth
Tax History
| Year | Tax Paid | Tax Assessment Tax Assessment Total Assessment is a certain percentage of the fair market value that is determined by local assessors to be the total taxable value of land and additions on the property. | Land | Improvement |
|---|---|---|---|---|
| 2025 | $108 | $780,200 | $147,100 | $633,100 |
| 2024 | $9,576 | $647,900 | $153,400 | $494,500 |
| 2023 | $9,396 | $603,100 | $151,000 | $452,100 |
| 2022 | $9,349 | $528,800 | $155,000 | $373,800 |
| 2021 | $8,521 | $461,600 | $128,300 | $333,300 |
| 2020 | $8,398 | $452,000 | $131,500 | $320,500 |
| 2019 | $8,092 | $429,300 | $131,500 | $297,800 |
| 2018 | $7,260 | $387,800 | $131,500 | $256,300 |
| 2017 | $7,402 | $393,700 | $131,500 | $262,200 |
| 2016 | $7,111 | $385,400 | $123,000 | $262,400 |
| 2015 | $7,209 | $393,100 | $122,000 | $271,100 |
Source: Public Records
Map
Nearby Homes