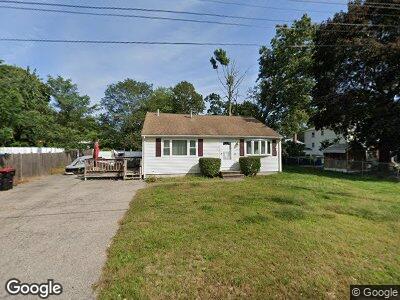
81 Snell Ave Brockton, MA 02302
Campello NeighborhoodEstimated Value: $467,163 - $511,000
3
Beds
2
Baths
1,401
Sq Ft
$345/Sq Ft
Est. Value
About This Home
This home is located at 81 Snell Ave, Brockton, MA 02302 and is currently estimated at $483,291, approximately $344 per square foot. 81 Snell Ave is a home located in Plymouth County with nearby schools including Gilmore Elementary School, Davis K-8 School, and John F. Kennedy Elementary School.
Ownership History
Date
Name
Owned For
Owner Type
Purchase Details
Closed on
Aug 30, 2007
Sold by
Spicer Patricia A
Bought by
Chatman Ronald S and Washington Tynesha L
Current Estimated Value
Home Financials for this Owner
Home Financials are based on the most recent Mortgage that was taken out on this home.
Original Mortgage
$248,106
Outstanding Balance
$161,738
Interest Rate
6.71%
Mortgage Type
Purchase Money Mortgage
Estimated Equity
$321,553
Purchase Details
Closed on
May 29, 1998
Sold by
King Beatrice Am
Bought by
Spicer Patricia A
Home Financials for this Owner
Home Financials are based on the most recent Mortgage that was taken out on this home.
Original Mortgage
$72,750
Interest Rate
7.12%
Mortgage Type
Purchase Money Mortgage
Create a Home Valuation Report for This Property
The Home Valuation Report is an in-depth analysis detailing your home's value as well as a comparison with similar homes in the area
Home Values in the Area
Average Home Value in this Area
Purchase History
| Date | Buyer | Sale Price | Title Company |
|---|---|---|---|
| Chatman Ronald S | $252,000 | -- | |
| Spicer Patricia A | $97,000 | -- |
Source: Public Records
Mortgage History
| Date | Status | Borrower | Loan Amount |
|---|---|---|---|
| Open | Washington Tynesha L | $18,039 | |
| Open | Washington Tynesha L | $35,354 | |
| Closed | Chatman Ronald S | $32,885 | |
| Open | King Beatrice Am | $248,106 | |
| Previous Owner | King Beatrice Am | $72,750 | |
| Previous Owner | King Beatrice Am | $19,400 |
Source: Public Records
Tax History Compared to Growth
Tax History
| Year | Tax Paid | Tax Assessment Tax Assessment Total Assessment is a certain percentage of the fair market value that is determined by local assessors to be the total taxable value of land and additions on the property. | Land | Improvement |
|---|---|---|---|---|
| 2025 | $5,137 | $424,200 | $159,200 | $265,000 |
| 2024 | $4,812 | $400,300 | $159,200 | $241,100 |
| 2023 | $4,887 | $376,500 | $109,400 | $267,100 |
| 2022 | $4,694 | $336,000 | $99,500 | $236,500 |
| 2021 | $4,138 | $285,400 | $92,000 | $193,400 |
| 2020 | $4,098 | $270,500 | $80,900 | $189,600 |
| 2019 | $4,067 | $261,700 | $77,100 | $184,600 |
| 2018 | $4,455 | $227,400 | $77,100 | $150,300 |
| 2017 | $3,492 | $216,900 | $77,100 | $139,800 |
| 2016 | $3,302 | $190,200 | $73,500 | $116,700 |
| 2015 | $2,958 | $163,000 | $73,500 | $89,500 |
| 2014 | $3,010 | $166,000 | $73,500 | $92,500 |
Source: Public Records
Map
Nearby Homes