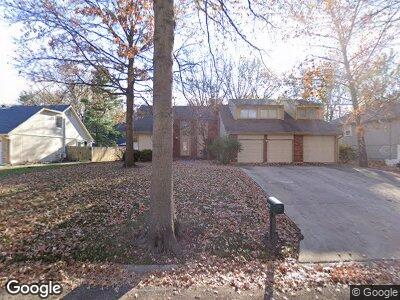
8103 W 101st St Overland Park, KS 66212
Pinehurst NeighborhoodEstimated Value: $517,663 - $567,000
4
Beds
3
Baths
2,875
Sq Ft
$186/Sq Ft
Est. Value
About This Home
This home is located at 8103 W 101st St, Overland Park, KS 66212 and is currently estimated at $535,416, approximately $186 per square foot. 8103 W 101st St is a home located in Johnson County with nearby schools including Brookridge Elementary School, Indian Woods Middle School, and Shawnee Mission South High School.
Create a Home Valuation Report for This Property
The Home Valuation Report is an in-depth analysis detailing your home's value as well as a comparison with similar homes in the area
Home Values in the Area
Average Home Value in this Area
Tax History Compared to Growth
Tax History
| Year | Tax Paid | Tax Assessment Tax Assessment Total Assessment is a certain percentage of the fair market value that is determined by local assessors to be the total taxable value of land and additions on the property. | Land | Improvement |
|---|---|---|---|---|
| 2024 | $4,437 | $45,862 | $13,764 | $32,098 |
| 2023 | $5,028 | $51,198 | $13,764 | $37,434 |
| 2022 | $4,677 | $47,966 | $13,764 | $34,202 |
| 2021 | $3,937 | $38,536 | $11,004 | $27,532 |
| 2020 | $3,962 | $38,812 | $9,571 | $29,241 |
| 2019 | $3,579 | $35,098 | $7,370 | $27,728 |
| 2018 | $3,444 | $33,637 | $7,370 | $26,267 |
| 2017 | $3,617 | $34,741 | $7,370 | $27,371 |
| 2016 | $3,436 | $32,464 | $7,370 | $25,094 |
| 2015 | $3,156 | $30,417 | $7,370 | $23,047 |
| 2013 | -- | $29,854 | $7,370 | $22,484 |
Source: Public Records
Map
Nearby Homes
- 10209 Hemlock Dr
- 10211 Robinson St
- 7700 W 100th Terrace
- 10224 Conser St
- 7912 W 98th Terrace
- 7501 W 99th Terrace
- 10013 Benson St
- 7409 W 102nd Ct
- 8417 W 98th Cir
- 9706 Craig Dr
- 7401 W 99th St
- 10027 Kessler St
- 10303 Benson St
- 8512 W 98th St
- 9623 Lowell Ave
- 8103 W 96th St
- 9004 W 104th St
- 10558 Foster St
- 10004 Oakridge Dr
- 7721 W 95th Terrace