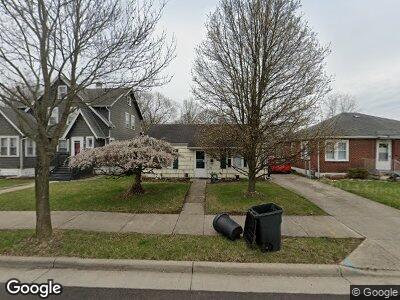
815 E McCreight Ave Springfield, OH 45503
Estimated Value: $88,710 - $114,000
2
Beds
1
Bath
720
Sq Ft
$141/Sq Ft
Est. Value
About This Home
This home is located at 815 E McCreight Ave, Springfield, OH 45503 and is currently estimated at $101,678, approximately $141 per square foot. 815 E McCreight Ave is a home located in Clark County with nearby schools including Lagonda Elementary School, Roosevelt Middle School, and Springfield High School.
Ownership History
Date
Name
Owned For
Owner Type
Purchase Details
Closed on
Aug 27, 1996
Sold by
Hopkins Cynthia K
Bought by
Lindsay Kathi A
Current Estimated Value
Home Financials for this Owner
Home Financials are based on the most recent Mortgage that was taken out on this home.
Original Mortgage
$48,550
Interest Rate
8.47%
Mortgage Type
FHA
Purchase Details
Closed on
Jun 17, 1992
Create a Home Valuation Report for This Property
The Home Valuation Report is an in-depth analysis detailing your home's value as well as a comparison with similar homes in the area
Home Values in the Area
Average Home Value in this Area
Purchase History
| Date | Buyer | Sale Price | Title Company |
|---|---|---|---|
| Lindsay Kathi A | $51,000 | -- | |
| -- | $34,400 | -- |
Source: Public Records
Mortgage History
| Date | Status | Borrower | Loan Amount |
|---|---|---|---|
| Open | Lindsay Kathi A | $3,425 | |
| Open | Lindsay Kathi A | $45,988 | |
| Closed | Lindsay Kathi A | $29,729 | |
| Closed | Lindsay Kathi A | $20,835 | |
| Closed | Lindsay Kathi A | $22,332 | |
| Closed | Lindsay Kathi A | $48,550 |
Source: Public Records
Tax History Compared to Growth
Tax History
| Year | Tax Paid | Tax Assessment Tax Assessment Total Assessment is a certain percentage of the fair market value that is determined by local assessors to be the total taxable value of land and additions on the property. | Land | Improvement |
|---|---|---|---|---|
| 2024 | $850 | $17,630 | $5,900 | $11,730 |
| 2023 | $850 | $17,630 | $5,900 | $11,730 |
| 2022 | $870 | $17,630 | $5,900 | $11,730 |
| 2021 | $697 | $13,030 | $4,250 | $8,780 |
| 2020 | $698 | $13,030 | $4,250 | $8,780 |
| 2019 | $700 | $13,030 | $4,250 | $8,780 |
| 2018 | $846 | $15,040 | $3,630 | $11,410 |
| 2017 | $846 | $11,845 | $3,630 | $8,215 |
| 2016 | $847 | $11,845 | $3,630 | $8,215 |
| 2015 | $792 | $11,845 | $3,630 | $8,215 |
| 2014 | $789 | $11,845 | $3,630 | $8,215 |
| 2013 | $781 | $11,845 | $3,630 | $8,215 |
Source: Public Records
Map
Nearby Homes
- 1124 Rodgers Dr Unit 1126
- 729 E Northern Ave
- 619 E Cassilly St
- 738 Rodgers Dr
- 501 E Madison Ave
- 380 Stanton Ave
- 1007 N Limestone St
- 456 Sherman Ave
- 121 E 1st St
- 925 Sherman Ave
- 1002 Wayne Ave
- 1024 Garfield Ave Unit 1026
- 1024-1026 Garfield Ave
- 1652 N Limestone St
- 1470 Mitchell Blvd
- 520 Mount Vernon Ave
- 1030 Sherman Ave Unit 1032
- 114-116 E Ward St