$91,000 - $156,000
RENTED SEP 21, 2024

82 Best St Bedford, OH 44146

3 Beds
2 Baths
974 Sq Ft
$124 Price per Sq Ft

Last Sold May 02, 2024

Last sale price $95,000 $98 Per Sq Ft

Est. 28% increase in value since last sale

Current estimated payment $894/month

About This Home

As of May 2024

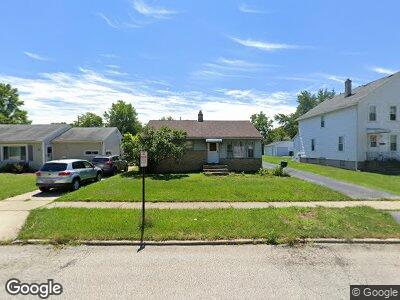
3 Bed 2 bath 2 Car Garage Just Updated all Bedrooms 1 floor New Flooring, Paint Inside and out Open floor plan full basement also....Great Location Owner is a licensed real estate agent in Ohio

Ownership History

Date Name Owned For Owner Type

Purchase Details

Listed on
Mar 25, 2024
Closed on
Apr 22, 2024
Sold by
Croasmun William F
Bought by
Salt Water Getaways Llc
Seller's Agent
C. Timothy Murphy
CTM Organization LLC
Buyer's Agent
Brett Young
Key Realty
List Price
$94,500
Sold Price
$95,000
Premium/Discount to List
$500
0.53%
Views
96
Current Estimated Value
$121,143

Home Financials for this Owner

Home Financials are based on the most recent Mortgage that was taken out on this home.
Estimated Appreciation
$26,143
Avg. Annual Appreciation
27.83%

Purchase Details

Closed on
Jan 1, 1975
Bought by
Croasmun William F

Range of Values:

Collateral Analytics

Collateral Analytics Collateral Analytics AVMs (Automated Valuation Model) employ a number of statistical approaches combined with neighborhood-specific comparable selection guarantees the most up-to-date and precise valuations.

Not Available

Collateral Analytics does not have data for the current month. Please view the chart for historical values.

ICE

ICE Mortgage Technology ICE Mortgage Technology’s AVM (Automated Valuation Model) is a state-of-the-art online residential property valuation tool that provides a quick and accurate estimate of the value of almost any home in the U.S.

Not Available

ICE Mortgage Technology does not have data for the current month. Please view the chart for historical values.

First American

First American First American Data & Analytics’ next-generation AVM combines unrivaled data assets with a blended ensemble of valuation models to produce highly accurate, reliable valuations you can trust.

Not Available

First American does not have data for the current month. Please view the chart for historical values.

Quantarium

Quantarium Quantarium’s valuation service, repeatedly proven the industry’s most accurate and comprehensive, is supercharged with a self-learning and auto-tuning AI engine that continually becomes smarter and more accurate as it processes daily inputs from the industry’s leading RE data lake.

Not Available

Quantarium does not have data for the current month. Please view the chart for historical values.

Average Value
Not Available
List Price
Sold Price
Create a Home Valuation Report for This Property
The Home Valuation Report is an in-depth analysis detailing your home's value as well as a comparison with similar homes in the area

Home Values in the Area

Source: Public Records

Average Home Value in this Area


Source: Public Records

Purchase History

Date Buyer Sale Price Title Company
Salt Water Getaways Llc $95,000 Innovative Title
Croasmun William F -- --
Source: Public Records

Mortgage History

Date Status Borrower Loan Amount
Open Croasmun William F $60,152
Closed Croasmun William F $14,800
Closed Croasmun William F $84,150
Closed Croasmun William F $96,500
Closed Croasmun William F $80,000
Source: Public Records

Property History

Date Event Price Change Sq Ft Price
09/21/2024 09/21/24 Rented $1,450 0.0% --
09/10/2024 09/10/24 Under Contract -- -- --
08/21/2024 08/21/24 Price Changed $1,450 -3.3% $1 / Sq Ft
08/13/2024 08/13/24 For Rent $1,500 0.0% --
05/02/2024 05/02/24 Sold $95,000 +0.5% $98 / Sq Ft
03/30/2024 03/30/24 Pending -- -- --
03/25/2024 03/25/24 For Sale $94,500 -- $97 / Sq Ft

Tax History Compared to Growth

Source: Public Records

Tax History

Year Tax Paid Tax Assessment Tax Assessment Total Assessment is a certain percentage of the fair market value that is determined by local assessors to be the total taxable value of land and additions on the property. Land Improvement
2024 $2,640 $43,120 $9,450 $33,670
2023 $2,588 $33,080 $8,090 $24,990
2022 $2,012 $33,075 $8,085 $24,990
2021 $1,940 $33,080 $8,090 $24,990
2020 $1,716 $27,790 $6,790 $21,000
2019 $1,675 $79,400 $19,400 $60,000
2018 $1,608 $27,790 $6,790 $21,000
2017 $1,571 $25,590 $6,230 $19,360
2016 $1,557 $25,590 $6,230 $19,360
2015 $3,231 $25,590 $6,230 $19,360
2014 $3,231 $27,830 $6,790 $21,040
Source: Public Records

Agents Affiliated with this Home

  • Section Image
  • Section Image
  • Section Image
See All Agents

Map