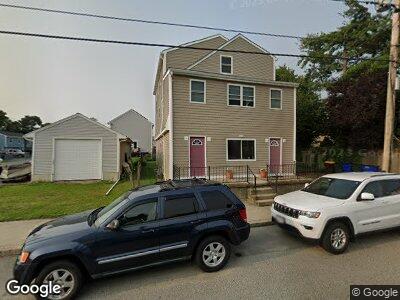
82 Mount Hope Ave Fall River, MA 02724
Sandy Beach NeighborhoodEstimated Value: $549,000 - $632,000
5
Beds
3
Baths
2,735
Sq Ft
$219/Sq Ft
Est. Value
About This Home
This home is located at 82 Mount Hope Ave, Fall River, MA 02724 and is currently estimated at $598,551, approximately $218 per square foot. 82 Mount Hope Ave is a home located in Bristol County with nearby schools including Carlton M. Viveiros Elementary School, Matthew J. Kuss Middle School, and B M C Durfee High School.
Ownership History
Date
Name
Owned For
Owner Type
Purchase Details
Closed on
Jun 27, 2016
Sold by
Kaegael Joseph M and Kaegael Bridget M
Bought by
Kaegael Joseph M
Current Estimated Value
Home Financials for this Owner
Home Financials are based on the most recent Mortgage that was taken out on this home.
Original Mortgage
$110,000
Outstanding Balance
$90,114
Interest Rate
4%
Mortgage Type
Adjustable Rate Mortgage/ARM
Estimated Equity
$508,437
Purchase Details
Closed on
Aug 13, 1987
Sold by
Dutra Winslow M
Bought by
Kaegael Joseph M
Home Financials for this Owner
Home Financials are based on the most recent Mortgage that was taken out on this home.
Original Mortgage
$102,000
Interest Rate
10.4%
Mortgage Type
Purchase Money Mortgage
Create a Home Valuation Report for This Property
The Home Valuation Report is an in-depth analysis detailing your home's value as well as a comparison with similar homes in the area
Home Values in the Area
Average Home Value in this Area
Purchase History
| Date | Buyer | Sale Price | Title Company |
|---|---|---|---|
| Kaegael Joseph M | -- | -- | |
| Kaegael Joseph M | $125,000 | -- |
Source: Public Records
Mortgage History
| Date | Status | Borrower | Loan Amount |
|---|---|---|---|
| Open | Kaegael Joseph M | $110,000 | |
| Previous Owner | Kaegael Joseph M | $20,000 | |
| Previous Owner | Kaegael Joseph M | $100,000 | |
| Previous Owner | Kaegael Joseph M | $6,100 | |
| Previous Owner | Kaegael Joseph M | $102,000 |
Source: Public Records
Tax History Compared to Growth
Tax History
| Year | Tax Paid | Tax Assessment Tax Assessment Total Assessment is a certain percentage of the fair market value that is determined by local assessors to be the total taxable value of land and additions on the property. | Land | Improvement |
|---|---|---|---|---|
| 2025 | $4,942 | $431,600 | $115,300 | $316,300 |
| 2024 | $4,763 | $414,500 | $113,000 | $301,500 |
| 2023 | $4,356 | $355,000 | $101,800 | $253,200 |
| 2022 | $3,915 | $310,200 | $96,100 | $214,100 |
| 2021 | $3,988 | $264,400 | $91,800 | $172,600 |
| 2020 | $3,326 | $230,200 | $87,600 | $142,600 |
| 2019 | $3,021 | $207,200 | $91,500 | $115,700 |
| 2018 | $2,860 | $195,600 | $92,200 | $103,400 |
| 2017 | $2,513 | $179,500 | $92,200 | $87,300 |
| 2016 | $2,457 | $180,300 | $95,000 | $85,300 |
| 2015 | $2,531 | $193,500 | $95,000 | $98,500 |
| 2014 | $2,545 | $202,300 | $95,000 | $107,300 |
Source: Public Records
Map
Nearby Homes
- 116 Atlantic Blvd
- 180 Mount Hope Ave
- 193 Mount Hope Ave
- 268 Moorland St
- 115 Arnold St
- 144 Bailey St
- 26 Cliff St
- 59 Hilton St
- 552 Bowen St
- 579 Summit St Unit 2
- 2573 S Main St
- 119 Wheeler St
- 173 Hooper St
- 919 Bay St Unit 106
- 500 Birch St
- 156 Bowen St
- 15 Higgins St
- 195 Butler St
- 81-89 Crawford St
- 102 Crawford St