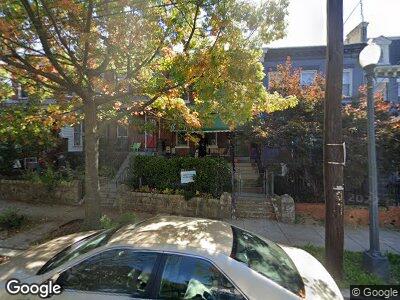
824 Allison St NW Washington, DC 20011
Petworth NeighborhoodEstimated Value: $582,783 - $749,000
3
Beds
1
Bath
1,280
Sq Ft
$523/Sq Ft
Est. Value
About This Home
This home is located at 824 Allison St NW, Washington, DC 20011 and is currently estimated at $669,196, approximately $522 per square foot. 824 Allison St NW is a home located in District of Columbia with nearby schools including Barnard Elementary School, MacFarland Middle School, and Roosevelt High School @ MacFarland.
Ownership History
Date
Name
Owned For
Owner Type
Purchase Details
Closed on
Dec 25, 2019
Sold by
Tillery Fred Alfred and Mosley Thelma L
Bought by
Tillery Fred Alfred and Anderson Camille S
Current Estimated Value
Home Financials for this Owner
Home Financials are based on the most recent Mortgage that was taken out on this home.
Original Mortgage
$419,000
Interest Rate
3.2%
Mortgage Type
New Conventional
Purchase Details
Closed on
Oct 5, 2019
Sold by
Mosley Thelma L and Tillery Fred Alfred
Bought by
Tillery Fred Alfred and Tillery Fred
Purchase Details
Closed on
Apr 15, 2015
Sold by
Mosley Thelma L
Bought by
Mosley Thelma L and Tillery Fred A
Purchase Details
Closed on
Dec 30, 1996
Sold by
Heyward + Marguerita V
Bought by
Mosley Thelma L and Mosley Willie
Home Financials for this Owner
Home Financials are based on the most recent Mortgage that was taken out on this home.
Original Mortgage
$56,250
Interest Rate
7.55%
Mortgage Type
New Conventional
Create a Home Valuation Report for This Property
The Home Valuation Report is an in-depth analysis detailing your home's value as well as a comparison with similar homes in the area
Home Values in the Area
Average Home Value in this Area
Purchase History
| Date | Buyer | Sale Price | Title Company |
|---|---|---|---|
| Tillery Fred Alfred | $121,967 | None Available | |
| Tillery Fred Alfred | -- | None Available | |
| Mosley Thelma L | -- | -- | |
| Mosley Thelma L | $75,000 | Island Title Corp |
Source: Public Records
Mortgage History
| Date | Status | Borrower | Loan Amount |
|---|---|---|---|
| Open | Anderson Camille S | $185,000 | |
| Open | Tillery Fred Alfred | $479,200 | |
| Previous Owner | Tillery Fred Alfred | $419,000 | |
| Previous Owner | Tillery Fred Alfred | $320,000 | |
| Previous Owner | Mosley Thelma L | $56,250 |
Source: Public Records
Tax History Compared to Growth
Tax History
| Year | Tax Paid | Tax Assessment Tax Assessment Total Assessment is a certain percentage of the fair market value that is determined by local assessors to be the total taxable value of land and additions on the property. | Land | Improvement |
|---|---|---|---|---|
| 2024 | $5,164 | $607,510 | $418,920 | $188,590 |
| 2023 | $5,057 | $594,950 | $411,440 | $183,510 |
| 2022 | $4,537 | $533,780 | $370,240 | $163,540 |
| 2021 | $4,316 | $507,820 | $360,790 | $147,030 |
| 2020 | $4,147 | $487,870 | $340,920 | $146,950 |
| 2019 | $3,808 | $448,010 | $310,570 | $137,440 |
| 2018 | $3,606 | $424,180 | $0 | $0 |
| 2017 | $3,166 | $372,460 | $0 | $0 |
| 2016 | $2,925 | $344,070 | $0 | $0 |
| 2015 | $2,712 | $319,110 | $0 | $0 |
| 2014 | $2,185 | $257,030 | $0 | $0 |
Source: Public Records
Map
Nearby Homes
- 4402 Kansas Ave NW
- 909 Webster St NW Unit 1
- 4527 9th St NW
- 4301 Kansas Ave NW
- 4521 Georgia Ave NW Unit 2
- 4523 Georgia Ave NW Unit 2
- 4328 Georgia Ave NW Unit 401
- 4328 Georgia Ave NW Unit 201
- 4328 Georgia Ave NW Unit B01
- 4328 Georgia Ave NW Unit B02
- 4328 Georgia Ave NW Unit 101
- 4326 Georgia Ave NW Unit 402
- 840 Varnum St NW
- 4616 8th St NW
- 907 Buchanan St NW
- 4214 8th St NW