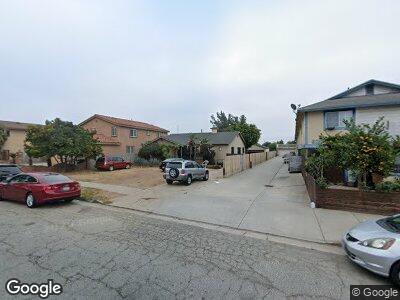
824 S Taylor Ave Montebello, CA 90640
Estimated Value: $755,000 - $829,000
3
Beds
2
Baths
1,615
Sq Ft
$484/Sq Ft
Est. Value
About This Home
This home is located at 824 S Taylor Ave, Montebello, CA 90640 and is currently estimated at $781,297, approximately $483 per square foot. 824 S Taylor Ave is a home located in Los Angeles County with nearby schools including Greenwood Elementary School, Montebello Intermediate School, and Montebello High School.
Ownership History
Date
Name
Owned For
Owner Type
Purchase Details
Closed on
Aug 23, 2021
Sold by
Ng Jessica Fung Fun and William And Jessica Ng Family
Bought by
Ng Jessica Fung Fun and William And Jessica Ng Family
Current Estimated Value
Purchase Details
Closed on
Apr 12, 2021
Sold by
Ng William Wui and Ng Jessica Fung Fun
Bought by
Ng Jessica Fung Fun and William And Jessica Ng Family
Purchase Details
Closed on
Feb 13, 2020
Sold by
Ho Ullin and Ho Magdalene Yun
Bought by
Ho Ullin and Ho Magdalene Yun
Purchase Details
Closed on
Jan 15, 2013
Sold by
Ho Magdalene Yun
Bought by
Ho Family Trust
Purchase Details
Closed on
Nov 6, 2012
Sold by
Ng William Wui
Bought by
Ng William Wui and Ng Jessica Fun
Purchase Details
Closed on
Dec 30, 2011
Sold by
Ho Magdalene Y
Bought by
Ng William Wui and Ho Magdalene Y
Purchase Details
Closed on
Oct 4, 1999
Sold by
Ho Magdalene Y Tr Ng Trust
Bought by
Ho Magdalene Y and The Ng Revocable Living Trust
Create a Home Valuation Report for This Property
The Home Valuation Report is an in-depth analysis detailing your home's value as well as a comparison with similar homes in the area
Home Values in the Area
Average Home Value in this Area
Purchase History
| Date | Buyer | Sale Price | Title Company |
|---|---|---|---|
| Ng Jessica Fung Fun | -- | None Available | |
| Ho Ullin | -- | None Available | |
| Ho Family Trust | -- | None Available | |
| Ng William Wui | -- | None Available | |
| Ng William Wui | -- | None Available | |
| Ho Magdalene Y | -- | -- |
Source: Public Records
Tax History Compared to Growth
Tax History
| Year | Tax Paid | Tax Assessment Tax Assessment Total Assessment is a certain percentage of the fair market value that is determined by local assessors to be the total taxable value of land and additions on the property. | Land | Improvement |
|---|---|---|---|---|
| 2024 | $3,354 | $176,677 | $85,350 | $91,327 |
| 2023 | $3,335 | $173,214 | $83,677 | $89,537 |
| 2022 | $3,230 | $169,819 | $82,037 | $87,782 |
| 2021 | $3,111 | $166,490 | $80,429 | $86,061 |
| 2020 | $3,042 | $164,784 | $79,605 | $85,179 |
| 2019 | $2,968 | $161,554 | $78,045 | $83,509 |
| 2018 | $2,846 | $158,387 | $76,515 | $81,872 |
| 2016 | $2,721 | $152,239 | $73,545 | $78,694 |
| 2015 | $2,595 | $149,953 | $72,441 | $77,512 |
| 2014 | $2,572 | $147,016 | $71,022 | $75,994 |
Source: Public Records
Map
Nearby Homes
- 717 S Greenwood Ave
- 630 S Maple Ave Unit 62
- 915 Carob Way Unit 5
- 915 Carob Way Unit 2
- 919 Carob Way
- 553 Calle Flor
- 1126 Calle Flor
- 561 Calle Flor
- 862 W Mines Ave
- 543 Calle Flor
- 524 Washington Blvd
- 932 S 5th St
- 1425 Date St
- 315 Mission Rd
- 1010 Sequoia Place
- 224 S Greenwood Ave
- 1301 S Greenwood Ave Unit 44
- 1301 S Greenwood Ave Unit 3
- 1601 W Los Angeles Ave
- 256 S Montebello Blvd