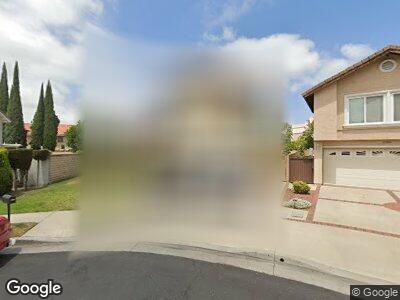
8245 Galaxy Cir Buena Park, CA 90620
Estimated Value: $1,191,000 - $1,320,000
4
Beds
3
Baths
2,610
Sq Ft
$478/Sq Ft
Est. Value
About This Home
This home is located at 8245 Galaxy Cir, Buena Park, CA 90620 and is currently estimated at $1,248,862, approximately $478 per square foot. 8245 Galaxy Cir is a home located in Orange County with nearby schools including Glen H. Dysinger Sr. Elementary School, Dale Jr High School, and Savanna High School.
Create a Home Valuation Report for This Property
The Home Valuation Report is an in-depth analysis detailing your home's value as well as a comparison with similar homes in the area
Home Values in the Area
Average Home Value in this Area
Tax History Compared to Growth
Tax History
| Year | Tax Paid | Tax Assessment Tax Assessment Total Assessment is a certain percentage of the fair market value that is determined by local assessors to be the total taxable value of land and additions on the property. | Land | Improvement |
|---|---|---|---|---|
| 2024 | $5,664 | $483,307 | $141,316 | $341,991 |
| 2023 | $5,523 | $473,831 | $138,545 | $335,286 |
| 2022 | $5,453 | $464,541 | $135,829 | $328,712 |
| 2021 | $5,375 | $455,433 | $133,166 | $322,267 |
| 2020 | $5,343 | $450,764 | $131,801 | $318,963 |
| 2019 | $5,208 | $441,926 | $129,217 | $312,709 |
| 2018 | $5,113 | $433,261 | $126,683 | $306,578 |
| 2017 | $4,951 | $424,766 | $124,199 | $300,567 |
| 2016 | $4,856 | $416,438 | $121,764 | $294,674 |
| 2015 | $4,802 | $410,183 | $119,935 | $290,248 |
| 2014 | $4,559 | $402,149 | $117,586 | $284,563 |
Source: Public Records
Map
Nearby Homes
- 8288 Mercury Dr
- 8259 Mercury Dr
- 8335 Galaxy Cir
- 8039 Maple Dr
- 8458 Mulberry Ave
- 8037 Cactus Cir
- 8295 Dracaena Dr
- 8062 Canna Cir
- 2961 W Lincoln Ave Unit 1
- 8446 Poppy Way
- 7581 Primrose Dr
- 7716 Lavender Cir
- 3053 W Coolidge Ave
- 3180 W Anacapa Way Unit 19
- 8404 Calendula Dr
- 2560 W Greenacre Ave
- 267 N Magnolia Ave Unit 2
- 405 N Magnolia Ave
- 2545 W Glenoaks Ave
- 2545 W Greenacre Ave