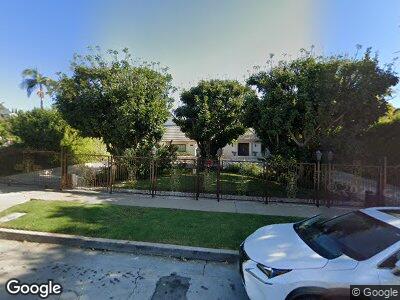
828 S Beverly Glen Blvd Los Angeles, CA 90024
Westwood NeighborhoodEstimated Value: $3,484,000 - $4,662,000
3
Beds
4
Baths
2,870
Sq Ft
$1,473/Sq Ft
Est. Value
About This Home
This home is located at 828 S Beverly Glen Blvd, Los Angeles, CA 90024 and is currently estimated at $4,227,635, approximately $1,473 per square foot. 828 S Beverly Glen Blvd is a home located in Los Angeles County with nearby schools including Warner Avenue Elementary, Ralph Waldo Emerson Community Charter Middle School, and University High School Charter.
Ownership History
Date
Name
Owned For
Owner Type
Purchase Details
Closed on
Jan 14, 2009
Sold by
Esfandi Rashel
Bought by
Esfandi Rashel and Trust A
Current Estimated Value
Purchase Details
Closed on
Apr 25, 2006
Sold by
Dannenberg Penelope and The Bernard J Leavitt Living T
Bought by
Esfandi Rashel
Home Financials for this Owner
Home Financials are based on the most recent Mortgage that was taken out on this home.
Original Mortgage
$1,969,500
Outstanding Balance
$1,199,197
Interest Rate
6.46%
Mortgage Type
Purchase Money Mortgage
Estimated Equity
$3,006,741
Purchase Details
Closed on
Feb 6, 2006
Sold by
Leavitt Bernard J
Bought by
Dannenberg Penelope
Purchase Details
Closed on
Aug 22, 1995
Sold by
Leavitt Bernard J
Bought by
Leavitt Bernard J and The Bernard J Leavitt Living Trust
Create a Home Valuation Report for This Property
The Home Valuation Report is an in-depth analysis detailing your home's value as well as a comparison with similar homes in the area
Home Values in the Area
Average Home Value in this Area
Purchase History
| Date | Buyer | Sale Price | Title Company |
|---|---|---|---|
| Esfandi Rashel | -- | None Available | |
| Esfandi Rashel | -- | Old Republic Title | |
| Leavitt Bernard J | -- | -- |
Source: Public Records
Mortgage History
| Date | Status | Borrower | Loan Amount |
|---|---|---|---|
| Open | Esfani Rashel | $1,159,664 | |
| Closed | Esfandi Rashel | $1,197,400 | |
| Closed | Esfandi Rashel | $1,253,000 | |
| Closed | Esfandi Rashel | $1,253,804 | |
| Open | Esfandi Rashel | $1,969,500 | |
| Previous Owner | Leavitt Bernard J | $500,000 |
Source: Public Records
Tax History Compared to Growth
Tax History
| Year | Tax Paid | Tax Assessment Tax Assessment Total Assessment is a certain percentage of the fair market value that is determined by local assessors to be the total taxable value of land and additions on the property. | Land | Improvement |
|---|---|---|---|---|
| 2024 | $45,950 | $3,777,675 | $2,460,118 | $1,317,557 |
| 2023 | $45,054 | $3,703,604 | $2,411,881 | $1,291,723 |
| 2022 | $42,951 | $3,630,986 | $2,364,590 | $1,266,396 |
| 2021 | $42,441 | $3,559,791 | $2,318,226 | $1,241,565 |
| 2019 | $41,165 | $3,454,208 | $2,249,467 | $1,204,741 |
| 2018 | $40,908 | $3,386,479 | $2,205,360 | $1,181,119 |
| 2016 | $39,156 | $3,254,979 | $2,119,724 | $1,135,255 |
| 2015 | $38,578 | $3,206,087 | $2,087,884 | $1,118,203 |
| 2014 | $36,940 | $3,000,000 | $1,953,400 | $1,046,600 |
Source: Public Records
Map
Nearby Homes
- 10375 Wilshire Blvd Unit 14GJ
- 10375 Wilshire Blvd Unit 2B
- 10375 Wilshire Blvd Unit 11F
- 10375 Wilshire Blvd Unit 3H
- 10375 Wilshire Blvd Unit 1B
- 850 Birchwood Dr
- 10341 Wilshire Blvd
- 10350 Wilshire Blvd Unit 602
- 10350 Wilshire Blvd Unit 1002
- 10350 Wilshire Blvd Unit 301
- 10433 Wilshire Blvd Unit 606
- 10336 Wilshire Blvd Unit 302
- 865 Comstock Ave Unit 4F
- 865 Comstock Ave Unit 12A
- 10301 Strathmore Dr
- 875 Comstock Ave Unit 3E
- 875 Comstock Ave Unit 15B/C
- 875 Comstock Ave Unit 4D
- 10457 Lindbrook Dr
- 10430 Wilshire Blvd Unit 1705