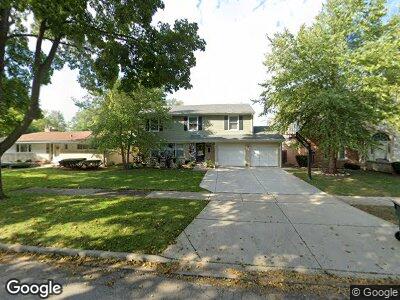
828 S Chestnut Ave Arlington Heights, IL 60005
Fairview NeighborhoodEstimated Value: $529,000 - $649,000
4
Beds
3
Baths
2,096
Sq Ft
$285/Sq Ft
Est. Value
About This Home
This home is located at 828 S Chestnut Ave, Arlington Heights, IL 60005 and is currently estimated at $598,223, approximately $285 per square foot. 828 S Chestnut Ave is a home located in Cook County with nearby schools including Westgate Elementary School, South Middle School, and Rolling Meadows High School.
Ownership History
Date
Name
Owned For
Owner Type
Purchase Details
Closed on
Feb 5, 2008
Sold by
Rumatz Theodore
Bought by
Riley Kevin James and Riley Jennifer Christina
Current Estimated Value
Home Financials for this Owner
Home Financials are based on the most recent Mortgage that was taken out on this home.
Original Mortgage
$293,620
Interest Rate
6.11%
Mortgage Type
Unknown
Purchase Details
Closed on
Jul 23, 1998
Sold by
Rumatz Mary Lou
Bought by
Rumatz Mary Lou and The Mary Lou Rumatz Trust
Create a Home Valuation Report for This Property
The Home Valuation Report is an in-depth analysis detailing your home's value as well as a comparison with similar homes in the area
Home Values in the Area
Average Home Value in this Area
Purchase History
| Date | Buyer | Sale Price | Title Company |
|---|---|---|---|
| Riley Kevin James | $367,500 | Git | |
| Rumatz Mary Lou | -- | -- |
Source: Public Records
Mortgage History
| Date | Status | Borrower | Loan Amount |
|---|---|---|---|
| Open | Riley Kevin James | $100,000 | |
| Open | Riley Kevin James | $302,000 | |
| Closed | Riley Kevin James | $305,800 | |
| Closed | Riley Kevin James | $293,500 | |
| Closed | Riley Kevin James | $293,620 |
Source: Public Records
Tax History Compared to Growth
Tax History
| Year | Tax Paid | Tax Assessment Tax Assessment Total Assessment is a certain percentage of the fair market value that is determined by local assessors to be the total taxable value of land and additions on the property. | Land | Improvement |
|---|---|---|---|---|
| 2024 | $11,226 | $46,000 | $9,530 | $36,470 |
| 2023 | $11,226 | $46,000 | $9,530 | $36,470 |
| 2022 | $11,226 | $46,000 | $9,530 | $36,470 |
| 2021 | $11,710 | $42,231 | $4,963 | $37,268 |
| 2020 | $11,474 | $42,231 | $4,963 | $37,268 |
| 2019 | $11,392 | $46,820 | $4,963 | $41,857 |
| 2018 | $11,514 | $42,891 | $4,368 | $38,523 |
| 2017 | $11,396 | $42,891 | $4,368 | $38,523 |
| 2016 | $10,865 | $42,891 | $4,368 | $38,523 |
| 2015 | $9,604 | $35,150 | $3,772 | $31,378 |
| 2014 | $9,339 | $35,150 | $3,772 | $31,378 |
| 2013 | $9,088 | $35,150 | $3,772 | $31,378 |
Source: Public Records
Map
Nearby Homes
- 410 W Kirchhoff Rd
- 1025 S Fernandez Ave Unit 4F
- 1107 S Vail Ave
- 1165 S Chestnut Ave
- 1430 (Lot 2) S Belmont Ave
- 326 E Central Rd
- 538 S Pine Ave
- 602 S Belmont Ave
- 514 S Pine Ave
- 901 S Burton Place
- 753 S Dwyer Ave Unit F
- 633 S Burton Place
- 406 W White Oak St
- 925 S Burton Place
- 1140 S Pine Ave
- 601 S Burton Place
- 4 E White Oak St
- 500 E Mayfair Rd
- 309 S Evergreen Ave
- 1310 W Francis Dr