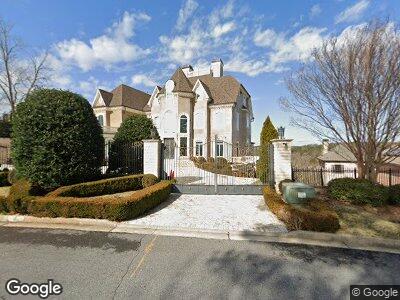
8330 Jett Ferry Rd Atlanta, GA 30350
Dunwoody Panhandle NeighborhoodEstimated Value: $2,288,515 - $4,632,000
6
Beds
9
Baths
18,000
Sq Ft
$180/Sq Ft
Est. Value
About This Home
This home is located at 8330 Jett Ferry Rd, Atlanta, GA 30350 and is currently estimated at $3,232,629, approximately $179 per square foot. 8330 Jett Ferry Rd is a home located in Fulton County with nearby schools including Dunwoody Springs Elementary School, Sandy Springs Middle School, and North Springs High School.
Ownership History
Date
Name
Owned For
Owner Type
Purchase Details
Closed on
Mar 26, 2010
Sold by
Hively Chris
Bought by
Harvey Broderick S Trust
Current Estimated Value
Home Financials for this Owner
Home Financials are based on the most recent Mortgage that was taken out on this home.
Original Mortgage
$2,362,500
Interest Rate
4.97%
Mortgage Type
New Conventional
Purchase Details
Closed on
Nov 1, 2007
Sold by
Hively Chris and Hively Lisa
Bought by
Skelton Henry G and Smith Kathleen
Home Financials for this Owner
Home Financials are based on the most recent Mortgage that was taken out on this home.
Original Mortgage
$0
Interest Rate
6.26%
Purchase Details
Closed on
Mar 27, 2003
Sold by
Tala Corp
Bought by
Hively James C
Home Financials for this Owner
Home Financials are based on the most recent Mortgage that was taken out on this home.
Original Mortgage
$650,000
Interest Rate
5.82%
Create a Home Valuation Report for This Property
The Home Valuation Report is an in-depth analysis detailing your home's value as well as a comparison with similar homes in the area
Home Values in the Area
Average Home Value in this Area
Purchase History
| Date | Buyer | Sale Price | Title Company |
|---|---|---|---|
| Harvey Broderick S Trust | $3,375,000 | -- | |
| Skelton Henry G | -- | -- | |
| Hively James C | $245,000 | -- |
Source: Public Records
Mortgage History
| Date | Status | Borrower | Loan Amount |
|---|---|---|---|
| Open | Harvet Broderick Steve | $2,500,000 | |
| Closed | Harvey Broderick S Trust | $2,362,500 | |
| Previous Owner | Hively Chris | $0 | |
| Previous Owner | Hively Chris | $3,315,000 | |
| Previous Owner | Hively James C | $650,000 |
Source: Public Records
Tax History Compared to Growth
Tax History
| Year | Tax Paid | Tax Assessment Tax Assessment Total Assessment is a certain percentage of the fair market value that is determined by local assessors to be the total taxable value of land and additions on the property. | Land | Improvement |
|---|---|---|---|---|
| 2023 | $41,554 | $1,000,000 | $160,480 | $839,520 |
| 2022 | $26,484 | $853,200 | $110,360 | $742,840 |
| 2021 | $33,433 | $853,200 | $110,360 | $742,840 |
| 2020 | $32,744 | $1,184,480 | $110,360 | $1,074,120 |
| 2019 | $37,984 | $1,163,520 | $108,400 | $1,055,120 |
| 2018 | $37,447 | $1,136,240 | $105,840 | $1,030,400 |
| 2017 | $31,725 | $935,640 | $73,840 | $861,800 |
| 2016 | $32,587 | $960,880 | $73,840 | $887,040 |
| 2015 | $32,702 | $960,880 | $73,840 | $887,040 |
| 2014 | $34,000 | $960,880 | $73,840 | $887,040 |
Source: Public Records
Map
Nearby Homes
- 8345 Jett Ferry Rd
- 3869 Teesdale Ct
- 2975 Coles Way
- 3821 Teesdale Ct
- 383 Caruso Ct
- 3119 W Addison Dr
- 405 Ashdowne Way
- 7865 Nesbit Ferry Rd
- 7635 Blandford Place
- 110 Cottage Gate Ln
- 1895 Redbourne Dr
- 116 Cottage Gate Ln
- 2370 Steeplechase Ln
- 8505 Haven Wood Trail
- 108 Cottage Gate Ln
- 700 Clubside Dr
- 106 Cottage Gate Ln