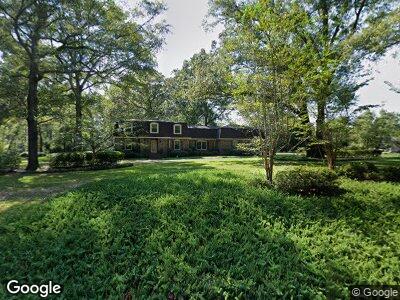
836 Motley Rd Hopkins, SC 29061
Estimated Value: $370,927 - $411,000
4
Beds
3
Baths
2,825
Sq Ft
$141/Sq Ft
Est. Value
About This Home
This home is located at 836 Motley Rd, Hopkins, SC 29061 and is currently estimated at $399,232, approximately $141 per square foot. 836 Motley Rd is a home located in Richland County with nearby schools including Horrell Hill Elementary School, Southeast Middle School, and Lower Richland High School.
Ownership History
Date
Name
Owned For
Owner Type
Purchase Details
Closed on
Apr 19, 2024
Sold by
Prichard Steven and Prichard Yvette
Bought by
Reimer Steven D
Current Estimated Value
Home Financials for this Owner
Home Financials are based on the most recent Mortgage that was taken out on this home.
Original Mortgage
$412,175
Interest Rate
6.74%
Mortgage Type
VA
Purchase Details
Closed on
Dec 17, 2018
Sold by
Stancil John
Bought by
Prichard Steven and Prichard Yvette
Purchase Details
Closed on
Dec 29, 2001
Sold by
Jordan Steven F and Thaxton Jessie J
Bought by
Stancil John
Home Financials for this Owner
Home Financials are based on the most recent Mortgage that was taken out on this home.
Original Mortgage
$137,300
Interest Rate
6.72%
Purchase Details
Closed on
Aug 15, 2001
Sold by
Jordan Steven F
Bought by
Jordan Steven F and Thaxton Jessie J
Create a Home Valuation Report for This Property
The Home Valuation Report is an in-depth analysis detailing your home's value as well as a comparison with similar homes in the area
Home Values in the Area
Average Home Value in this Area
Purchase History
| Date | Buyer | Sale Price | Title Company |
|---|---|---|---|
| Reimer Steven D | $403,500 | South Carolina Title | |
| Prichard Steven | $200,000 | None Available | |
| Stancil John | $152,559 | -- | |
| Jordan Steven F | -- | -- |
Source: Public Records
Mortgage History
| Date | Status | Borrower | Loan Amount |
|---|---|---|---|
| Open | Reimer Steven D | $420,592 | |
| Closed | Reimer Steven D | $412,175 | |
| Previous Owner | Prichard Steven M | $50,000 | |
| Previous Owner | Stancil John | $169,600 | |
| Previous Owner | Stancil John E | $10,000 | |
| Previous Owner | Stancil John | $25,000 | |
| Previous Owner | Stancil John | $137,300 |
Source: Public Records
Tax History Compared to Growth
Tax History
| Year | Tax Paid | Tax Assessment Tax Assessment Total Assessment is a certain percentage of the fair market value that is determined by local assessors to be the total taxable value of land and additions on the property. | Land | Improvement |
|---|---|---|---|---|
| 2023 | $6,212 | $8,000 | $0 | $0 |
| 2022 | $1,337 | $200,000 | $40,100 | $159,900 |
| 2021 | $1,340 | $8,000 | $0 | $0 |
| 2020 | $1,709 | $8,000 | $0 | $0 |
| 2019 | $5,732 | $12,000 | $0 | $0 |
| 2018 | $249 | $0 | $0 | $0 |
| 2017 | $249 | $0 | $0 | $0 |
| 2016 | $249 | $0 | $0 | $0 |
| 2015 | $249 | $0 | $0 | $0 |
| 2014 | $249 | $0 | $0 | $0 |
| 2013 | -- | $7,770 | $0 | $0 |
Source: Public Records
Map
Nearby Homes
- 329 Crooked Pine Ct
- 812 Motley Rd
- 2098 Grovefield Dr
- 612 Marbled Teal Ln
- 604 Marbled Teal Ln
- 704 Common Widgeon Way
- 607 Marbled Teal Ln
- 1127 Horrell Hill Rd
- 1140 Congaree Rd
- 0 Garners Ferry Rd Unit 604474
- 0 Garners Ferry Rd Unit 589777
- 240 Burbage Ct
- 1242 Crosshill Rd
- 9900 Garners Ferry Rd
- 7070 Lower Richland Blvd
- 990 Harvest Valley Ln
- 988 Harvest Valley Ln
- 1014 Goose Branch Dr
- 1016 Goose Branch Dr
- 1020 Goose Branch Dr