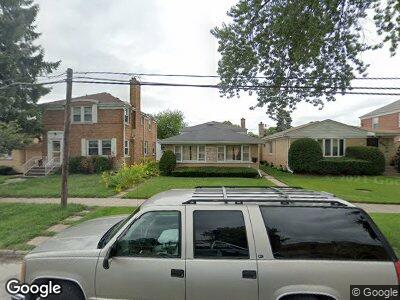
8429 Lockwood Ave Skokie, IL 60077
Southwest Skokie NeighborhoodEstimated Value: $422,451 - $441,000
3
Beds
2
Baths
1,200
Sq Ft
$357/Sq Ft
Est. Value
About This Home
This home is located at 8429 Lockwood Ave, Skokie, IL 60077 and is currently estimated at $428,363, approximately $356 per square foot. 8429 Lockwood Ave is a home located in Cook County with nearby schools including Madison Elementary School, Thomas Edison Elementary School, and Lincoln Junior High School.
Ownership History
Date
Name
Owned For
Owner Type
Purchase Details
Closed on
Oct 24, 2003
Sold by
Laura Chardentavophpanich Somboon and Laura Cwaimearbthum
Bought by
Sunu Samuel John and Sunu John
Current Estimated Value
Home Financials for this Owner
Home Financials are based on the most recent Mortgage that was taken out on this home.
Original Mortgage
$220,000
Interest Rate
6.03%
Mortgage Type
Stand Alone First
Purchase Details
Closed on
Jun 30, 1994
Sold by
Wiese Irene G
Bought by
Ladda Charoentavornpanich Somboon and Ladda Chaimearbthum
Home Financials for this Owner
Home Financials are based on the most recent Mortgage that was taken out on this home.
Original Mortgage
$152,000
Interest Rate
8.61%
Create a Home Valuation Report for This Property
The Home Valuation Report is an in-depth analysis detailing your home's value as well as a comparison with similar homes in the area
Home Values in the Area
Average Home Value in this Area
Purchase History
| Date | Buyer | Sale Price | Title Company |
|---|---|---|---|
| Sunu Samuel John | $320,000 | Cti | |
| Ladda Charoentavornpanich Somboon | $190,000 | Ati Title Company |
Source: Public Records
Mortgage History
| Date | Status | Borrower | Loan Amount |
|---|---|---|---|
| Open | Samuel John | $198,000 | |
| Previous Owner | Sunu Samuel John | $220,000 | |
| Previous Owner | Thia Somboon | $194,400 | |
| Previous Owner | Thia Somboon | $200,000 | |
| Previous Owner | Thia Somboon C | $25,000 | |
| Previous Owner | Thia Somboon C | $25,000 | |
| Previous Owner | Ladda Charoentavornpanich Somboon | $152,000 |
Source: Public Records
Tax History Compared to Growth
Tax History
| Year | Tax Paid | Tax Assessment Tax Assessment Total Assessment is a certain percentage of the fair market value that is determined by local assessors to be the total taxable value of land and additions on the property. | Land | Improvement |
|---|---|---|---|---|
| 2024 | $7,709 | $30,888 | $5,688 | $25,200 |
| 2023 | $7,709 | $30,888 | $5,688 | $25,200 |
| 2022 | $7,709 | $30,888 | $5,688 | $25,200 |
| 2021 | $9,003 | $28,189 | $3,500 | $24,689 |
| 2020 | $9,021 | $28,189 | $3,500 | $24,689 |
| 2019 | $9,079 | $31,674 | $3,500 | $28,174 |
| 2018 | $8,528 | $27,256 | $3,171 | $24,085 |
| 2017 | $8,588 | $27,256 | $3,171 | $24,085 |
| 2016 | $8,390 | $27,256 | $3,171 | $24,085 |
| 2015 | $7,325 | $23,137 | $2,734 | $20,403 |
| 2014 | $7,180 | $23,137 | $2,734 | $20,403 |
| 2013 | $7,254 | $23,137 | $2,734 | $20,403 |
Source: Public Records
Map
Nearby Homes
- 5322 Lee St
- 8224 Laramie Ave
- 5451 Main St
- 5506 Lincoln Ave Unit A211
- 5510 Lincoln Ave Unit B202
- 5235 Cleveland St
- 8232 Niles Center Rd Unit 316
- 5001 Madison St Unit 3F
- 8142 Lincoln Ave
- 8161 Niles Center Rd Unit 3C
- 8230 Elmwood St Unit 204
- 8210 Elmwood Ave Unit 415
- 8525 Major Ave
- 4837 Conrad St
- 8450 Skokie Blvd Unit 206
- 8308 Mango Ave
- 4740 Main St Unit D
- 5200 Galitz St Unit 205
- 8700 Skokie Blvd Unit 3N
- 8644 Skokie Blvd