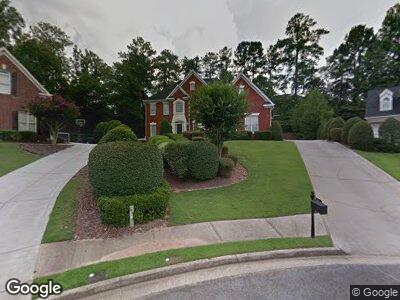
845 Thornberry Dr Alpharetta, GA 30022
Estimated Value: $850,304 - $969,000
4
Beds
4
Baths
3,445
Sq Ft
$258/Sq Ft
Est. Value
About This Home
This home is located at 845 Thornberry Dr, Alpharetta, GA 30022 and is currently estimated at $888,076, approximately $257 per square foot. 845 Thornberry Dr is a home located in Fulton County with nearby schools including Northwood Elementary School, Haynes Bridge Middle School, and Centennial High School.
Ownership History
Date
Name
Owned For
Owner Type
Purchase Details
Closed on
Sep 15, 2008
Sold by
Riccardo Joseph A
Bought by
Dougherty Robert and Dougherty Elizaveta
Current Estimated Value
Home Financials for this Owner
Home Financials are based on the most recent Mortgage that was taken out on this home.
Original Mortgage
$488,000
Interest Rate
6.63%
Mortgage Type
New Conventional
Purchase Details
Closed on
Jul 15, 1998
Sold by
Smoke Trace Inc
Bought by
Whalen David P and Whalen Jackye A
Home Financials for this Owner
Home Financials are based on the most recent Mortgage that was taken out on this home.
Original Mortgage
$352,000
Interest Rate
7.02%
Mortgage Type
New Conventional
Create a Home Valuation Report for This Property
The Home Valuation Report is an in-depth analysis detailing your home's value as well as a comparison with similar homes in the area
Home Values in the Area
Average Home Value in this Area
Purchase History
| Date | Buyer | Sale Price | Title Company |
|---|---|---|---|
| Dougherty Robert | $610,000 | -- | |
| Whalen David P | $440,000 | -- |
Source: Public Records
Mortgage History
| Date | Status | Borrower | Loan Amount |
|---|---|---|---|
| Closed | Dougherty Robert P | $800,000 | |
| Closed | Dougherty Robert | $488,000 | |
| Previous Owner | Riccardo Joseph A | $200,000 | |
| Previous Owner | Riccardo Joseph A | $100,000 | |
| Previous Owner | Riccardo Joseph A | $233,000 | |
| Previous Owner | Whalen David P | $352,000 |
Source: Public Records
Tax History Compared to Growth
Tax History
| Year | Tax Paid | Tax Assessment Tax Assessment Total Assessment is a certain percentage of the fair market value that is determined by local assessors to be the total taxable value of land and additions on the property. | Land | Improvement |
|---|---|---|---|---|
| 2023 | $7,186 | $254,600 | $86,000 | $168,600 |
| 2022 | $6,300 | $239,440 | $44,760 | $194,680 |
| 2021 | $6,814 | $207,240 | $34,160 | $173,080 |
| 2020 | $6,745 | $201,080 | $37,440 | $163,640 |
| 2019 | $1,027 | $178,640 | $32,200 | $146,440 |
| 2018 | $4,924 | $174,440 | $31,440 | $143,000 |
| 2017 | $4,527 | $155,160 | $24,240 | $130,920 |
| 2016 | $4,528 | $155,160 | $24,240 | $130,920 |
| 2015 | $5,439 | $155,160 | $24,240 | $130,920 |
| 2014 | $4,551 | $148,480 | $18,120 | $130,360 |
Source: Public Records
Map
Nearby Homes
- 10416 Park Walk Point
- 790 Thornberry Dr
- 315 Stanyan Place
- 10625 Haynes Forest Dr
- 3150 Berkshire Manor Dr
- 10215 Alvin Rd
- 10350 Alvin Rd
- 10420 Summer Creek Dr
- 230 Summerfield Dr
- 3015 Ascot Ln
- 10245 Old Woodland Entry
- 300 Olmstead Way
- 230 Society St
- 3335 New Heritage Dr
- 2590 Runic Way
- 605 Tatum Ct
- 10015 Timberstone Rd
- 105 Kinross Ct