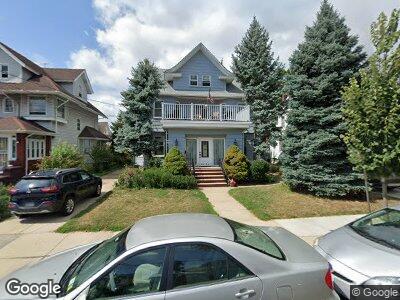
86-50 105th St Richmond Hill, NY 11418
Richmond Hill NeighborhoodEstimated Value: $1,176,000 - $1,251,000
--
Bed
4
Baths
2,937
Sq Ft
$412/Sq Ft
Est. Value
About This Home
This home is located at 86-50 105th St, Richmond Hill, NY 11418 and is currently estimated at $1,211,008, approximately $412 per square foot. 86-50 105th St is a home located in Queens County with nearby schools including Ps 66 Jacqueline Kennedy Onassis, Jhs 210 Elizabeth Blackwell, and Richmond Hill High School.
Ownership History
Date
Name
Owned For
Owner Type
Purchase Details
Closed on
Jul 31, 2017
Sold by
Jaffe Theresa
Bought by
Jaffe Theresa and Jaffe, Trustee, Kenneth J
Current Estimated Value
Purchase Details
Closed on
Sep 15, 2016
Sold by
Reagan Elspeth
Bought by
Jaffe James and Jaffe Theresa
Home Financials for this Owner
Home Financials are based on the most recent Mortgage that was taken out on this home.
Original Mortgage
$639,900
Interest Rate
3.45%
Mortgage Type
Purchase Money Mortgage
Purchase Details
Closed on
Mar 21, 2003
Sold by
Potapenkov Nikolai
Bought by
Reagan Elspeth
Purchase Details
Closed on
Dec 5, 2001
Sold by
Florio Thomas Michael
Bought by
Potapenkov Nikolai
Home Financials for this Owner
Home Financials are based on the most recent Mortgage that was taken out on this home.
Original Mortgage
$397,800
Interest Rate
7.15%
Create a Home Valuation Report for This Property
The Home Valuation Report is an in-depth analysis detailing your home's value as well as a comparison with similar homes in the area
Home Values in the Area
Average Home Value in this Area
Purchase History
| Date | Buyer | Sale Price | Title Company |
|---|---|---|---|
| Jaffe Theresa | -- | -- | |
| Jaffe James M | -- | -- | |
| Jaffe James | -- | -- | |
| Jaffe James | $790,000 | -- | |
| Reagan Elspeth | $535,000 | -- | |
| Potapenkov Nikolai | -- | -- |
Source: Public Records
Mortgage History
| Date | Status | Borrower | Loan Amount |
|---|---|---|---|
| Previous Owner | Jaffe James | $639,900 | |
| Previous Owner | Reagan Elspeth | $402,500 | |
| Previous Owner | Reagan Elspeth | $417,000 | |
| Previous Owner | Reagan Elspeth | $417,000 | |
| Previous Owner | Reagan Elspeth | $100,000 | |
| Previous Owner | Potapenkov Nikolai | $397,800 | |
| Closed | Reagan Elspeth | $0 |
Source: Public Records
Tax History Compared to Growth
Tax History
| Year | Tax Paid | Tax Assessment Tax Assessment Total Assessment is a certain percentage of the fair market value that is determined by local assessors to be the total taxable value of land and additions on the property. | Land | Improvement |
|---|---|---|---|---|
| 2024 | $9,281 | $49,087 | $16,056 | $33,031 |
| 2023 | $8,723 | $46,310 | $13,140 | $33,170 |
| 2022 | $8,670 | $61,620 | $20,940 | $40,680 |
| 2021 | $9,067 | $58,560 | $20,940 | $37,620 |
| 2020 | $8,568 | $58,560 | $20,940 | $37,620 |
| 2019 | $7,955 | $53,820 | $20,940 | $32,880 |
| 2018 | $7,280 | $38,592 | $15,393 | $23,199 |
| 2017 | $7,514 | $38,592 | $18,706 | $19,886 |
| 2016 | $7,347 | $38,592 | $18,706 | $19,886 |
| 2015 | $4,343 | $36,134 | $22,219 | $13,915 |
| 2014 | $4,343 | $34,089 | $22,081 | $12,008 |
Source: Public Records
Map
Nearby Homes
- 102-42 86th Rd
- 86-07 105th St
- 104-59 88th Ave
- 102-42 85th Dr
- 10209 87th Ave
- 86-03 102nd St Unit 2D
- 8667 108th St
- 104-60 89th Ave
- 8534 108th St
- 86-10 109th St Unit B3
- 89-06 107th St
- 8546 109th St
- 10237 90th Ave
- 10231 90th Ave
- 100-21 87th Ave
- 85-30 101st St
- 8746 109th St
- 10431 91st Ave
- 10014 88th Ave
- 8730 110th St