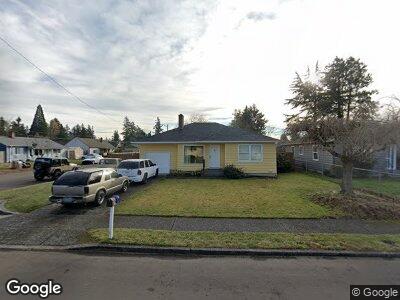
8619 Mt Thielsen Ave Vancouver, WA 98664
Vancouver Heights NeighborhoodEstimated Value: $401,122 - $421,000
2
Beds
1
Bath
1,108
Sq Ft
$371/Sq Ft
Est. Value
About This Home
This home is located at 8619 Mt Thielsen Ave, Vancouver, WA 98664 and is currently estimated at $411,281, approximately $371 per square foot. 8619 Mt Thielsen Ave is a home located in Clark County with nearby schools including George C. Marshall Elementary School, McLoughlin Middle School, and Fort Vancouver High School.
Ownership History
Date
Name
Owned For
Owner Type
Purchase Details
Closed on
Nov 7, 2019
Sold by
Terry Mark
Bought by
Terry Carleen
Current Estimated Value
Purchase Details
Closed on
Sep 13, 2017
Sold by
Terry William W
Bought by
Terry Mark
Purchase Details
Closed on
Jan 17, 2002
Sold by
Terry Gregory J and Terry Nichole
Bought by
Terry William W
Home Financials for this Owner
Home Financials are based on the most recent Mortgage that was taken out on this home.
Original Mortgage
$135,857
Interest Rate
6.84%
Mortgage Type
FHA
Purchase Details
Closed on
Dec 22, 2001
Sold by
Terry Gregory J and Terry William W
Bought by
Terry Gregory J and Terry Carleen
Home Financials for this Owner
Home Financials are based on the most recent Mortgage that was taken out on this home.
Original Mortgage
$135,857
Interest Rate
6.84%
Mortgage Type
FHA
Create a Home Valuation Report for This Property
The Home Valuation Report is an in-depth analysis detailing your home's value as well as a comparison with similar homes in the area
Home Values in the Area
Average Home Value in this Area
Purchase History
| Date | Buyer | Sale Price | Title Company |
|---|---|---|---|
| Terry Carleen | $109,525 | Fidelity Natl Ttl Co Of Wa | |
| Terry Mark | -- | None Available | |
| Terry William W | $138,000 | Cascade Title | |
| Terry Gregory J | -- | -- |
Source: Public Records
Mortgage History
| Date | Status | Borrower | Loan Amount |
|---|---|---|---|
| Previous Owner | Terry William W | $135,857 |
Source: Public Records
Tax History Compared to Growth
Tax History
| Year | Tax Paid | Tax Assessment Tax Assessment Total Assessment is a certain percentage of the fair market value that is determined by local assessors to be the total taxable value of land and additions on the property. | Land | Improvement |
|---|---|---|---|---|
| 2025 | $3,639 | $387,873 | $195,342 | $192,531 |
| 2024 | $3,542 | $372,421 | $195,342 | $177,079 |
| 2023 | $3,448 | $378,393 | $195,342 | $183,051 |
| 2022 | $3,191 | $369,817 | $195,342 | $174,475 |
| 2021 | $2,784 | $318,929 | $168,398 | $150,531 |
| 2020 | $2,532 | $262,232 | $124,817 | $137,415 |
| 2019 | $2,304 | $247,139 | $115,109 | $132,030 |
| 2018 | $2,420 | $232,881 | $0 | $0 |
| 2017 | $2,125 | $203,099 | $0 | $0 |
| 2016 | $1,926 | $186,092 | $0 | $0 |
| 2015 | $1,927 | $161,156 | $0 | $0 |
| 2014 | -- | $152,500 | $0 | $0 |
| 2013 | -- | $126,248 | $0 | $0 |
Source: Public Records
Map
Nearby Homes
- 127 N Lieser Rd
- 8401 SE Middle Way
- 1017 SE Columbia Ridge Dr
- 319 Charlotte Way
- 101 NE 95th Ave
- 7509 Delaware Ln
- 216 SE 98th Ave
- 7921 Mill Plain Ct
- 1510 SE 86th Ct
- 1407 SE 82nd Ct
- 400 SE 101st Ave
- 7604 SE Evergreen Hwy
- 1512 SE Hawks View Ct
- 8001 SE Evergreen Hwy
- 208 N Knoxville Way
- 7711 SE 16th Cir
- 7520 Michigan St
- 516 N Knoxville Way
- 2102 SE 95th Ct
- 10002 NE 9th St