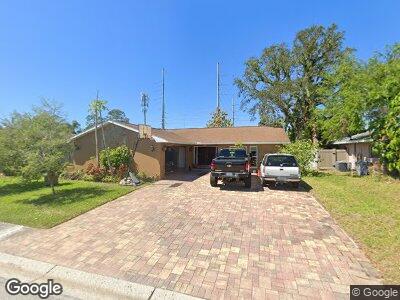
8637 Pinetree Dr W Seminole, FL 33772
Leona Heights NeighborhoodEstimated Value: $536,740 - $611,000
3
Beds
2
Baths
1,700
Sq Ft
$336/Sq Ft
Est. Value
About This Home
This home is located at 8637 Pinetree Dr W, Seminole, FL 33772 and is currently estimated at $570,435, approximately $335 per square foot. 8637 Pinetree Dr W is a home located in Pinellas County with nearby schools including Bauder Elementary School, Seminole Middle School, and Seminole High School.
Ownership History
Date
Name
Owned For
Owner Type
Purchase Details
Closed on
May 7, 2015
Sold by
Hunter William and Brown Cynthia Ann
Bought by
Birmingham Daniel J and Malingam Jiraporn
Current Estimated Value
Purchase Details
Closed on
Dec 7, 2009
Sold by
Blisniuk Michael A
Bought by
Hunter William and Hunter Cynthia A
Home Financials for this Owner
Home Financials are based on the most recent Mortgage that was taken out on this home.
Original Mortgage
$144,800
Interest Rate
5.01%
Mortgage Type
New Conventional
Purchase Details
Closed on
Jul 5, 2001
Sold by
Blisniuk Alexander and Blisniuk Carmen
Bought by
Blisniuk Michael A
Purchase Details
Closed on
Nov 30, 2000
Sold by
Tindall Dennis L
Bought by
Blisniuk Michael A
Purchase Details
Closed on
Mar 1, 2000
Sold by
Tindall Dennis L and Tindall Linda C
Bought by
Blisniuk Michael A and Blusniuk Alexander
Create a Home Valuation Report for This Property
The Home Valuation Report is an in-depth analysis detailing your home's value as well as a comparison with similar homes in the area
Home Values in the Area
Average Home Value in this Area
Purchase History
| Date | Buyer | Sale Price | Title Company |
|---|---|---|---|
| Birmingham Daniel J | $238,500 | Bankers Title | |
| Hunter William | $181,000 | Albritton Title Inc | |
| Blisniuk Michael A | -- | -- | |
| Blisniuk Michael A | -- | -- | |
| Blisniuk Michael A | $142,000 | -- |
Source: Public Records
Mortgage History
| Date | Status | Borrower | Loan Amount |
|---|---|---|---|
| Open | Birmingham Daniel J | $160,000 | |
| Previous Owner | Hunter William | $144,800 | |
| Previous Owner | Blisniuk Michael A | $18,200 | |
| Previous Owner | Blisniuk Michael A | $139,900 | |
| Previous Owner | Blisniuk Michael A | $135,300 |
Source: Public Records
Tax History Compared to Growth
Tax History
| Year | Tax Paid | Tax Assessment Tax Assessment Total Assessment is a certain percentage of the fair market value that is determined by local assessors to be the total taxable value of land and additions on the property. | Land | Improvement |
|---|---|---|---|---|
| 2024 | $4,513 | $298,241 | -- | -- |
| 2023 | $4,513 | $289,554 | $0 | $0 |
| 2022 | $4,400 | $281,120 | $0 | $0 |
| 2021 | $4,469 | $272,932 | $0 | $0 |
| 2020 | $4,510 | $269,164 | $0 | $0 |
| 2019 | $5,169 | $259,508 | $101,812 | $157,696 |
| 2018 | $4,847 | $240,883 | $0 | $0 |
| 2017 | $4,641 | $226,865 | $0 | $0 |
| 2016 | $4,413 | $212,130 | $0 | $0 |
| 2015 | $2,751 | $161,974 | $0 | $0 |
| 2014 | -- | $130,867 | $0 | $0 |
Source: Public Records
Map
Nearby Homes
- 8899 125th St
- 8845 123rd Way
- 12597 83rd Ave
- 8510 King St
- 12290 89th Terrace
- 12431 Monarch Cir
- 12280 90th Ave
- 8763 Matthew St
- 8350 Monarch Cir
- 12299 91st Ave N
- 12391 83rd Ave
- 12430 81st Place
- 9034 127th Ln
- 8236 128th St
- 9098 127th Ln
- 12352 83rd Ave
- 12359 82nd Ave
- 12432 81st Ct
- 11980 Valencia Ct
- 12467 93rd Ave