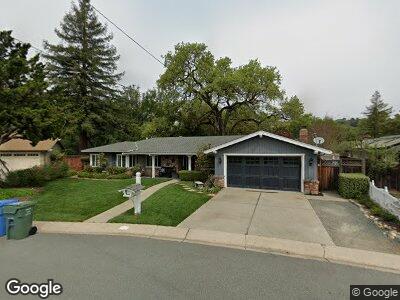
873 Avalon Ct Lafayette, CA 94549
Trails NeighborhoodEstimated Value: $1,834,000 - $1,895,000
3
Beds
2
Baths
1,893
Sq Ft
$979/Sq Ft
Est. Value
About This Home
This home is located at 873 Avalon Ct, Lafayette, CA 94549 and is currently estimated at $1,853,343, approximately $979 per square foot. 873 Avalon Ct is a home located in Contra Costa County with nearby schools including Lafayette Elementary School, M.H. Stanley Middle School, and Acalanes High School.
Ownership History
Date
Name
Owned For
Owner Type
Purchase Details
Closed on
May 8, 2006
Sold by
Leetham Jeanie S
Bought by
Zuber Jon E and Zuber Shannon M
Current Estimated Value
Home Financials for this Owner
Home Financials are based on the most recent Mortgage that was taken out on this home.
Original Mortgage
$908,000
Interest Rate
6.37%
Mortgage Type
Purchase Money Mortgage
Purchase Details
Closed on
Aug 23, 2004
Sold by
Leetham William Cuzner
Bought by
Leetham Jeanie S
Home Financials for this Owner
Home Financials are based on the most recent Mortgage that was taken out on this home.
Original Mortgage
$440,000
Interest Rate
5.76%
Mortgage Type
Credit Line Revolving
Purchase Details
Closed on
Mar 10, 2000
Sold by
Sheets Clarence E Jr Tre
Bought by
Leetham Jeanie Symes
Purchase Details
Closed on
Mar 9, 2000
Sold by
Leetham William C
Bought by
Leetham Jeanie Symes
Create a Home Valuation Report for This Property
The Home Valuation Report is an in-depth analysis detailing your home's value as well as a comparison with similar homes in the area
Home Values in the Area
Average Home Value in this Area
Purchase History
| Date | Buyer | Sale Price | Title Company |
|---|---|---|---|
| Zuber Jon E | $1,135,000 | First American Title Co | |
| Leetham Jeanie S | -- | -- | |
| Leetham Jeanie S | -- | -- | |
| Leetham Jeanie Symes | $620,000 | Placer Title Company | |
| Leetham Jeanie Symes | -- | Placer Title |
Source: Public Records
Mortgage History
| Date | Status | Borrower | Loan Amount |
|---|---|---|---|
| Open | Zuber Jon E | $592,000 | |
| Closed | Zuber Jon E | $417,000 | |
| Closed | Zuber Jon E | $575,500 | |
| Closed | Zuber Jon E | $250,000 | |
| Closed | Zuber Jon E | $908,000 | |
| Previous Owner | Leetham Jeanie S | $440,000 | |
| Previous Owner | Leetham Jeanie S | $440,000 | |
| Previous Owner | Leetham Jeanie Symes | $100,000 |
Source: Public Records
Tax History Compared to Growth
Tax History
| Year | Tax Paid | Tax Assessment Tax Assessment Total Assessment is a certain percentage of the fair market value that is determined by local assessors to be the total taxable value of land and additions on the property. | Land | Improvement |
|---|---|---|---|---|
| 2024 | $18,333 | $1,520,645 | $1,339,246 | $181,399 |
| 2023 | $18,333 | $1,490,830 | $1,312,987 | $177,843 |
| 2022 | $18,054 | $1,461,599 | $1,287,243 | $174,356 |
| 2021 | $16,903 | $1,375,000 | $1,210,974 | $164,026 |
| 2019 | $16,071 | $1,296,000 | $1,141,397 | $154,603 |
| 2018 | $15,428 | $1,263,500 | $1,112,774 | $150,726 |
| 2017 | $15,438 | $1,263,500 | $1,112,773 | $150,727 |
| 2016 | $14,729 | $1,200,500 | $1,057,289 | $143,211 |
| 2015 | $13,812 | $1,135,000 | $999,602 | $135,398 |
| 2014 | $12,216 | $980,000 | $863,092 | $116,908 |
Source: Public Records
Map
Nearby Homes
- 3533 Plaza Way
- 966 3rd St
- 921 Foye Dr
- 950 Hough Ave Unit 201
- 950 Hough Ave Unit 307
- 950 Hough Ave Unit 209
- 950 Hough Ave Unit 303
- 210 Lafayette Cir Unit 101
- 940 Dewing Ave Unit B
- 3525 Boyer Cir
- 906 Brown Ave
- 945 Yorkshire Ct
- 3609 Walnut St
- 3579 Boyer Cir
- 10 the Nines
- 22 the Nines
- 18 the Nines
- 30 the Nines
- 783 Solana Dr
- 3356 Victoria Ave