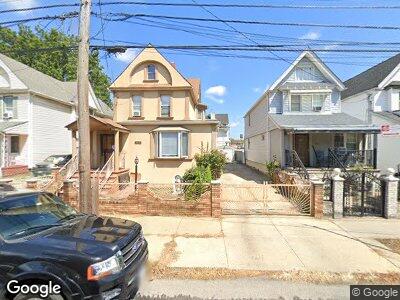
8761 118th St Richmond Hill, NY 11418
Richmond Hill NeighborhoodEstimated Value: $741,000 - $811,000
3
Beds
3
Baths
1,344
Sq Ft
$571/Sq Ft
Est. Value
About This Home
This home is located at 8761 118th St, Richmond Hill, NY 11418 and is currently estimated at $768,012, approximately $571 per square foot. 8761 118th St is a home located in Queens County with nearby schools including P.S. 51, P.S. 56 - Harry Eichler, and M.S.137 America's School of Heroes.
Ownership History
Date
Name
Owned For
Owner Type
Purchase Details
Closed on
Dec 10, 2024
Sold by
Ghannie Nazeema K.K and Ghannie Shameeza K.K
Bought by
Ramkirpal Carl Haripaul
Current Estimated Value
Home Financials for this Owner
Home Financials are based on the most recent Mortgage that was taken out on this home.
Original Mortgage
$600,000
Outstanding Balance
$598,982
Interest Rate
6.84%
Mortgage Type
Purchase Money Mortgage
Estimated Equity
$169,030
Purchase Details
Closed on
Nov 19, 2001
Sold by
Landay Gurbachan S and Kaur Usha
Bought by
Ghannie Nazeema K K and Ghannie Shameeza K K
Home Financials for this Owner
Home Financials are based on the most recent Mortgage that was taken out on this home.
Original Mortgage
$220,162
Interest Rate
6.84%
Purchase Details
Closed on
Feb 24, 1995
Sold by
Carbone Cosmo A and Carbone Carol Ann M
Bought by
Landay Gurbachan S and Kaur Usha
Home Financials for this Owner
Home Financials are based on the most recent Mortgage that was taken out on this home.
Original Mortgage
$90,000
Interest Rate
4.25%
Create a Home Valuation Report for This Property
The Home Valuation Report is an in-depth analysis detailing your home's value as well as a comparison with similar homes in the area
Home Values in the Area
Average Home Value in this Area
Purchase History
| Date | Buyer | Sale Price | Title Company |
|---|---|---|---|
| Ramkirpal Carl Haripaul | $750,000 | -- | |
| Ghannie Nazeema K K | -- | -- | |
| Ghannie Nazeema K K | -- | -- | |
| Landay Gurbachan S | $136,000 | -- | |
| Landay Gurbachan S | $136,000 | -- |
Source: Public Records
Mortgage History
| Date | Status | Borrower | Loan Amount |
|---|---|---|---|
| Open | Ramkirpal Carl Haripaul | $600,000 | |
| Previous Owner | Ghannie Nazeema K K | $220,162 | |
| Previous Owner | Landay Gurbachan S | $90,000 |
Source: Public Records
Tax History Compared to Growth
Tax History
| Year | Tax Paid | Tax Assessment Tax Assessment Total Assessment is a certain percentage of the fair market value that is determined by local assessors to be the total taxable value of land and additions on the property. | Land | Improvement |
|---|---|---|---|---|
| 2024 | $6,117 | $30,456 | $9,293 | $21,163 |
| 2023 | $5,779 | $28,771 | $8,016 | $20,755 |
| 2022 | $5,563 | $39,840 | $12,120 | $27,720 |
| 2021 | $5,865 | $34,140 | $12,120 | $22,020 |
| 2020 | $5,694 | $34,860 | $12,120 | $22,740 |
| 2019 | $5,309 | $36,300 | $12,120 | $24,180 |
| 2018 | $4,887 | $23,976 | $8,806 | $15,170 |
| 2017 | $4,734 | $23,223 | $9,162 | $14,061 |
| 2016 | $4,642 | $23,223 | $9,162 | $14,061 |
| 2015 | $2,423 | $22,417 | $11,570 | $10,847 |
| 2014 | $2,423 | $21,150 | $11,844 | $9,306 |
Source: Public Records
Map
Nearby Homes
- 8754 117th St
- 89-27 120th St
- 87-38 115th St
- 116-14 Myrtle Ave
- 114-02 Jamaica Ave
- 8921 121st St
- 87-38 114th St
- 8759 123rd St
- 113-10 Jamaica Ave
- 120-16 91st Ave
- 8951 121st St
- 87-20 124th St
- 124-04 Jamaica Ave
- 112-04 Jamaica Ave
- 91-54 117th St
- 120-12 85th Ave Unit 3A
- 117-06 Atlantic Ave
- 104-33 Atlantic Ave
- 87-79 111th St
- 86-27 125th St