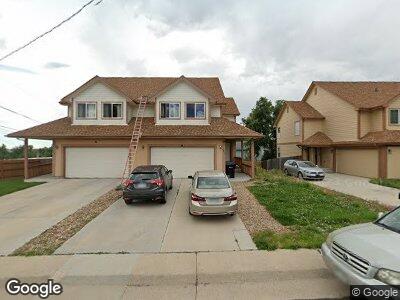
8870 W 63rd Ave Arvada, CO 80004
Scenic Heights NeighborhoodEstimated Value: $674,000 - $774,394
4
Beds
4
Baths
2,718
Sq Ft
$262/Sq Ft
Est. Value
About This Home
This home is located at 8870 W 63rd Ave, Arvada, CO 80004 and is currently estimated at $712,099, approximately $261 per square foot. 8870 W 63rd Ave is a home located in Jefferson County with nearby schools including Secrest Elementary School, Peck Elementary School, and Arvada K-8.
Ownership History
Date
Name
Owned For
Owner Type
Purchase Details
Closed on
Feb 12, 2020
Sold by
Krueger Ryan S and Mun Susie A
Bought by
Hibbert Scoti R
Current Estimated Value
Home Financials for this Owner
Home Financials are based on the most recent Mortgage that was taken out on this home.
Original Mortgage
$444,600
Outstanding Balance
$398,660
Interest Rate
3.72%
Mortgage Type
New Conventional
Estimated Equity
$313,439
Purchase Details
Closed on
Dec 16, 2016
Sold by
Inka Group Llc
Bought by
Krueger Ryan S and Mun Susie A
Home Financials for this Owner
Home Financials are based on the most recent Mortgage that was taken out on this home.
Original Mortgage
$375,250
Interest Rate
3.54%
Mortgage Type
New Conventional
Purchase Details
Closed on
Oct 6, 2015
Sold by
One Residential Llc
Bought by
8868 W 63Rd Ave Llc
Purchase Details
Closed on
Mar 27, 2013
Sold by
One Residential Llc
Bought by
8868 W 63Rd Ave Llc
Create a Home Valuation Report for This Property
The Home Valuation Report is an in-depth analysis detailing your home's value as well as a comparison with similar homes in the area
Home Values in the Area
Average Home Value in this Area
Purchase History
| Date | Buyer | Sale Price | Title Company |
|---|---|---|---|
| Hibbert Scoti R | $468,000 | Fidelity National Title | |
| Krueger Ryan S | $395,000 | Heritage Title Co | |
| 8868 W 63Rd Ave Llc | -- | Fidelity National Title Ins | |
| 8868 W 63Rd Ave Llc | -- | None Available |
Source: Public Records
Mortgage History
| Date | Status | Borrower | Loan Amount |
|---|---|---|---|
| Open | Hibbert Scott | $87,000 | |
| Open | Hibbert Scoti R | $444,600 | |
| Previous Owner | Krueger Ryan S | $375,250 |
Source: Public Records
Tax History Compared to Growth
Tax History
| Year | Tax Paid | Tax Assessment Tax Assessment Total Assessment is a certain percentage of the fair market value that is determined by local assessors to be the total taxable value of land and additions on the property. | Land | Improvement |
|---|---|---|---|---|
| 2024 | $4,290 | $44,232 | $12,619 | $31,613 |
| 2023 | $4,290 | $44,232 | $12,619 | $31,613 |
| 2022 | $3,778 | $38,576 | $10,640 | $27,936 |
| 2021 | $3,840 | $39,686 | $10,946 | $28,740 |
| 2020 | $3,180 | $32,955 | $6,263 | $26,692 |
| 2019 | $3,137 | $32,955 | $6,263 | $26,692 |
| 2018 | $2,927 | $29,892 | $6,223 | $23,669 |
| 2017 | $2,679 | $29,892 | $6,223 | $23,669 |
| 2016 | $1,520 | $15,979 | $15,979 | $0 |
| 2015 | $806 | $15,979 | $15,979 | $0 |
| 2014 | $806 | $7,961 | $7,961 | $0 |
Source: Public Records
Map
Nearby Homes
- 6250 Everett Ct Unit F
- 6240 Everett Ct Unit F
- 6240 Everett Ct Unit B
- 9044 W 63rd Ave
- 9105 Oberon Rd Unit 2
- 8885 W 64th Place
- 9175 Cole Dr
- 8487 W 62nd Place
- 8801 W 65th Ave
- 8467 W 62nd Place
- 8500 W 62nd Ave Unit D
- 6190 Garrison St
- 8408 W 62nd Place
- 6142 Dudley Ct
- 6409 Brentwood St
- 6614 Everett St
- 8233 W 62nd Place
- 9013 W 66th Place
- 8250 W 63rd Ave
- 6535 Brentwood St