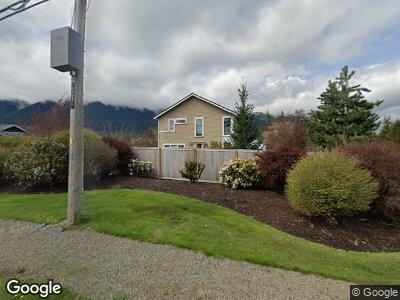
890 SE 10th St North Bend, WA 98045
Estimated Value: $1,169,198 - $1,220,000
4
Beds
3
Baths
2,230
Sq Ft
$533/Sq Ft
Est. Value
About This Home
This home is located at 890 SE 10th St, North Bend, WA 98045 and is currently estimated at $1,189,050, approximately $533 per square foot. 890 SE 10th St is a home located in King County with nearby schools including North Bend Elementary School, Twin Falls Middle School, and Mount Si High School.
Ownership History
Date
Name
Owned For
Owner Type
Purchase Details
Closed on
Aug 24, 2005
Sold by
Friedman Amy B and Friedman Scott E
Bought by
Rorem Bradley J and Rorem Carrie G
Current Estimated Value
Home Financials for this Owner
Home Financials are based on the most recent Mortgage that was taken out on this home.
Original Mortgage
$367,920
Interest Rate
6%
Purchase Details
Closed on
Apr 22, 2004
Sold by
Friedman Scott E
Bought by
Friedman Scott E and Friedman Amy B
Home Financials for this Owner
Home Financials are based on the most recent Mortgage that was taken out on this home.
Original Mortgage
$298,400
Interest Rate
5.5%
Purchase Details
Closed on
Oct 5, 2001
Sold by
Pochop Michael A and Pochop Julie M
Bought by
Friedman Scott E
Home Financials for this Owner
Home Financials are based on the most recent Mortgage that was taken out on this home.
Original Mortgage
$298,300
Interest Rate
6.62%
Create a Home Valuation Report for This Property
The Home Valuation Report is an in-depth analysis detailing your home's value as well as a comparison with similar homes in the area
Home Values in the Area
Average Home Value in this Area
Purchase History
| Date | Buyer | Sale Price | Title Company |
|---|---|---|---|
| Rorem Bradley J | $459,950 | Commonwealth L | |
| Friedman Scott E | -- | Commonwealth L | |
| Friedman Scott E | $314,000 | Washington Title | |
| Friedman Scott E | -- | Washington Title |
Source: Public Records
Mortgage History
| Date | Status | Borrower | Loan Amount |
|---|---|---|---|
| Open | Rorem Carrie G | $592,000 | |
| Closed | Rorem Carrie G | $373,664 | |
| Closed | Rorem Carrie G | $160,000 | |
| Closed | Rorem Bradley J | $367,920 | |
| Previous Owner | Friedman Scott E | $298,400 | |
| Previous Owner | Friedman Scott E | $298,300 | |
| Closed | Friedman Scott E | $74,600 |
Source: Public Records
Tax History Compared to Growth
Tax History
| Year | Tax Paid | Tax Assessment Tax Assessment Total Assessment is a certain percentage of the fair market value that is determined by local assessors to be the total taxable value of land and additions on the property. | Land | Improvement |
|---|---|---|---|---|
| 2024 | $9,396 | $1,014,000 | $365,000 | $649,000 |
| 2023 | $8,609 | $902,000 | $332,000 | $570,000 |
| 2022 | $8,408 | $1,001,000 | $380,000 | $621,000 |
| 2021 | $7,804 | $777,000 | $289,000 | $488,000 |
| 2020 | $7,339 | $654,000 | $244,000 | $410,000 |
| 2018 | $6,826 | $571,000 | $197,000 | $374,000 |
| 2017 | $5,603 | $553,000 | $189,000 | $364,000 |
| 2016 | $5,288 | $468,000 | $166,000 | $302,000 |
| 2015 | $4,774 | $422,000 | $148,000 | $274,000 |
| 2014 | -- | $412,000 | $145,000 | $267,000 |
| 2013 | -- | $336,000 | $122,000 | $214,000 |
Source: Public Records
Map
Nearby Homes
- 950 SE Symmons Place
- 897 SE 11th Place
- 871 SE 11th Place Unit 38
- 1104 Swiftwater Way SE Unit 40
- 1133 Maloney Grove Ave SE Unit LOT40
- 1132 Swiftwater Way SE Unit 34
- 1160 Swiftwater Way SE Unit 32
- 1031 SE 12th St
- 1336 Salish Ave SE
- 908 Riverside Dr SE
- 1499 Glacier Ave SE
- 13635 424th Ave SE
- 321 SE Orchard Dr Unit 16
- 386 Zemp Way NE
- 1850 SE 12th Place Unit 204
- 1850 SE 12th Place Unit 203
- 1222 Confluence Way SE Unit 201
- 1230 Confluence Way SE Unit 202
- 1222 Confluence Way SE Unit 301
- 1222 Confluence Way SE Unit 303