R
Seller's Agent in 2023
Ryan Foley
Greater Metropolitan R. E.
(617) 523-2505
6 in this area
12 Total Sales


Estimated Value: $2,786,000 - $3,116,611
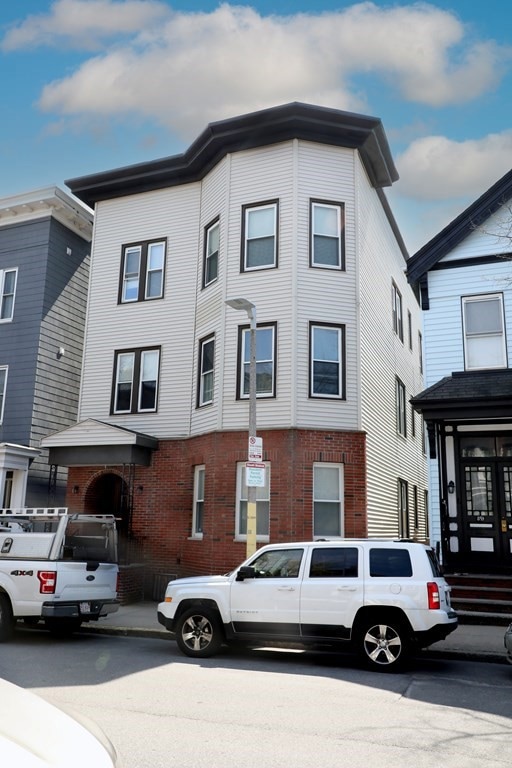
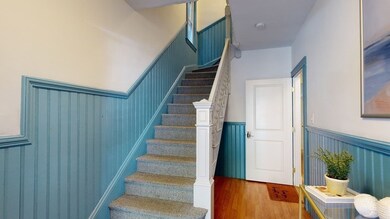
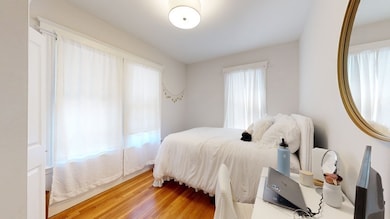
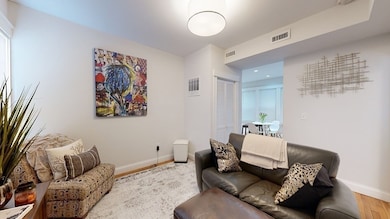
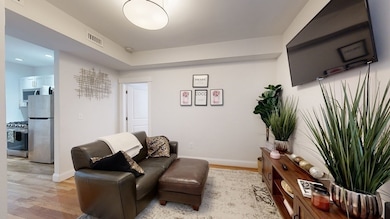
Massive 3-family asset with 14 bedrooms in pristine condition located in South Boston’s City Point.. All apartments, drenched in natural sunlight, boast hardwood floors, brand new kitchens, 2 full bathrooms, central A/C, extra large bedrooms, in-unit washer and dryers, and oversized covered decks. First floor is a 4-bed/2-bath, second and third floors are both 5-bed/2-baths. Leases signed thru August 31st, 2024 at a staggering $20,300 per month. Extremely high ceilings in the basement offer fantastic future expansion opportunities. Huge fenced in back yard with patio. Steps to the beach and all else that South Boston has to offer.
Home Type
Est. Annual Taxes
Year Built
Lot Details
Home Design
Bedrooms and Bathrooms
Parking
Utilities
Additional Features
Listing and Financial Details
Overview
Amenities
Recreation
Building Details
| Date | Status | Borrower | Loan Amount |
|---|---|---|---|
| Closed | Sylvia Michael C | $1,750,000 | |
| Closed | 893 E 4Th Street Llc | $1,895,000 | |
| Closed | 893 E 4Th Street Rt | $25,000 |
| Date | Event | Price | Change | Sq Ft Price |
|---|---|---|---|---|
| 09/21/2023 09/21/23 | Sold | $3,100,000 | -2.4% | $672 / Sq Ft |
| 06/05/2023 06/05/23 | For Sale | $3,175,000 | 0.0% | $688 / Sq Ft |
| 06/04/2023 06/04/23 | Off Market | $3,175,000 | -- | -- |
| 06/01/2023 06/01/23 | For Sale | $3,175,000 | 0.0% | $688 / Sq Ft |
| 11/07/2017 11/07/17 | Rented | $3,000 | 0.0% | -- |
| 11/03/2017 11/03/17 | For Rent | $3,000 | -- | -- |
| Year | Tax Paid | Tax Assessment Tax Assessment Total Assessment is a certain percentage of the fair market value that is determined by local assessors to be the total taxable value of land and additions on the property. | Land | Improvement |
|---|---|---|---|---|
| 2025 | $29,873 | $2,579,700 | $508,000 | $2,071,700 |
| 2024 | $23,011 | $2,111,100 | $394,900 | $1,716,200 |
| 2023 | $20,447 | $1,903,800 | $365,600 | $1,538,200 |
| 2022 | $18,831 | $1,730,800 | $332,400 | $1,398,400 |
| 2021 | $18,468 | $1,730,800 | $332,400 | $1,398,400 |
| 2020 | $14,506 | $1,373,700 | $350,400 | $1,023,300 |
| 2019 | $13,166 | $1,249,100 | $246,400 | $1,002,700 |
| 2018 | $12,229 | $1,166,900 | $246,400 | $920,500 |
| 2017 | $11,764 | $1,110,900 | $246,400 | $864,500 |
| 2016 | $10,626 | $966,000 | $246,400 | $719,600 |
| 2015 | $9,958 | $822,300 | $221,000 | $601,300 |
| 2014 | $9,762 | $776,000 | $221,000 | $555,000 |
R
Seller's Agent in 2023
Ryan Foley
Greater Metropolitan R. E.
(617) 523-2505
6 in this area
12 Total Sales
T
Buyer's Agent in 2023
Terrier Team
Compass
(617) 206-3333
3 in this area
16 Total Sales

Seller's Agent in 2017
Michelle Talbot
Grove Property Group
(617) 596-1948
5 in this area
15 Total Sales
Source: MLS Property Information Network (MLS PIN)
MLS Number: 73119113
APN: SBOS-000000-000006-004336
Disclaimer: Certain information contained herein is derived from information provided by parties other than Homes.com. All information provided is deemed reliable, but is not guaranteed to be accurate and should be independently verified.
![]() The property listing data and information, or the Images, set forth herein were provided to MLS Property Information Network, Inc. from third party sources, including sellers, lessors and public records, and were compiled by MLS Property Information Network, Inc. The property listing data and information, and the Images, are for the personal, non-commercial use of consumers having a good faith interest in purchasing or leasing listed properties of the type displayed to them and may not be used for any purpose other than to identify prospective properties which such consumers may have a good faith interest in purchasing or leasing. MLS Property Information Network, Inc. and its subscribers disclaim any and all representations and warranties as to the accuracy of the property listing data and information, or as to the accuracy of any of the Images, set forth herein.
The property listing data and information, or the Images, set forth herein were provided to MLS Property Information Network, Inc. from third party sources, including sellers, lessors and public records, and were compiled by MLS Property Information Network, Inc. The property listing data and information, and the Images, are for the personal, non-commercial use of consumers having a good faith interest in purchasing or leasing listed properties of the type displayed to them and may not be used for any purpose other than to identify prospective properties which such consumers may have a good faith interest in purchasing or leasing. MLS Property Information Network, Inc. and its subscribers disclaim any and all representations and warranties as to the accuracy of the property listing data and information, or as to the accuracy of any of the Images, set forth herein.