Estimated Value: $978,186 - $1,078,000
5
Beds
4
Baths
3,339
Sq Ft
$305/Sq Ft
Est. Value
About This Home
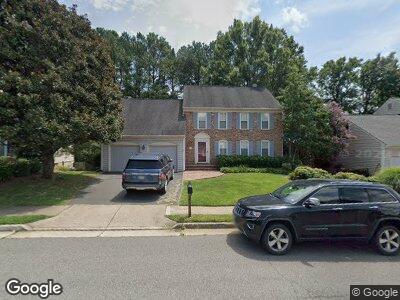
This home is located at 8943 Kenilworth Dr, Burke, VA 22015 and is currently estimated at $1,019,547, approximately $305 per square foot. 8943 Kenilworth Dr is a home located in Fairfax County with nearby schools including Ravensworth Elementary School, Lake Braddock Secondary School, and Holy Spirit School.
Ownership History
Date
Name
Owned For
Owner Type
Purchase Details
Closed on
Aug 4, 2010
Sold by
Duncan James T
Bought by
Starkey Scott B
Current Estimated Value
Home Financials for this Owner
Home Financials are based on the most recent Mortgage that was taken out on this home.
Original Mortgage
$417,000
Interest Rate
4.73%
Mortgage Type
New Conventional
Purchase Details
Closed on
May 5, 2000
Sold by
Lohman Jack A
Bought by
Duncan James Thomas
Home Financials for this Owner
Home Financials are based on the most recent Mortgage that was taken out on this home.
Original Mortgage
$256,000
Interest Rate
8.21%
Create a Home Valuation Report for This Property
The Home Valuation Report is an in-depth analysis detailing your home's value as well as a comparison with similar homes in the area
Home Values in the Area
Average Home Value in this Area
Purchase History
| Date | Buyer | Sale Price | Title Company |
|---|---|---|---|
| Starkey Scott B | $629,000 | -- | |
| Duncan James Thomas | $320,000 | -- |
Source: Public Records
Mortgage History
| Date | Status | Borrower | Loan Amount |
|---|---|---|---|
| Open | Starkey Scott B | $409,000 | |
| Closed | Starkey Scott B | $417,000 | |
| Previous Owner | Duncan James T | $155,000 | |
| Previous Owner | Duncan James Thomas | $256,000 |
Source: Public Records
Tax History Compared to Growth
Tax History
| Year | Tax Paid | Tax Assessment Tax Assessment Total Assessment is a certain percentage of the fair market value that is determined by local assessors to be the total taxable value of land and additions on the property. | Land | Improvement |
|---|---|---|---|---|
| 2024 | $9,975 | $861,040 | $300,000 | $561,040 |
| 2023 | $9,717 | $861,040 | $300,000 | $561,040 |
| 2022 | $9,088 | $794,720 | $280,000 | $514,720 |
| 2021 | $8,644 | $736,590 | $260,000 | $476,590 |
| 2020 | $8,133 | $687,240 | $250,000 | $437,240 |
| 2019 | $7,961 | $672,670 | $244,000 | $428,670 |
| 2018 | $7,678 | $667,670 | $239,000 | $428,670 |
| 2017 | $7,433 | $640,260 | $232,000 | $408,260 |
| 2016 | $7,199 | $621,370 | $225,000 | $396,370 |
| 2015 | $6,934 | $621,370 | $225,000 | $396,370 |
| 2014 | $6,630 | $595,440 | $225,000 | $370,440 |
Source: Public Records
Map
Nearby Homes
- 5420 Flint Tavern Place
- 9013 Parliament Dr
- 5446 Mount Corcoran Place
- 5507 Kings Park Dr
- 5260 Signal Hill Dr
- 8901 Burke Rd
- 9108 Fox Lair Dr
- 5833 Banning Place
- 9005 Advantage Ct
- 5853 Banning Place
- 5820 Fitzhugh St
- 5517 Yorkshire St
- 5526 Yorkshire St
- 9004 Advantage Ct
- 9210 Byron Terrace
- 5844 Kara Place
- 8941 Burke Lake Rd
- 8618 Kenilworth Dr
- 9002 Fern Park Dr Unit 1
- 9013 Brook Ford Rd