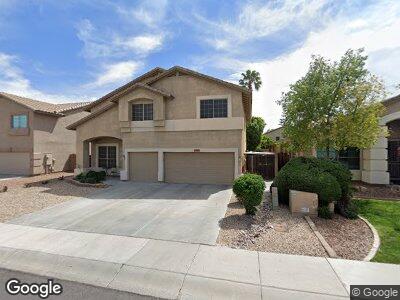
8983 W Potter Dr Peoria, AZ 85382
Estimated Value: $565,032 - $633,000
--
Bed
3
Baths
2,764
Sq Ft
$220/Sq Ft
Est. Value
About This Home
This home is located at 8983 W Potter Dr, Peoria, AZ 85382 and is currently estimated at $607,258, approximately $219 per square foot. 8983 W Potter Dr is a home located in Maricopa County with nearby schools including Coyote Hills Elementary School, Sunrise Mountain High School, and Guidepost Montessori at Peoria.
Ownership History
Date
Name
Owned For
Owner Type
Purchase Details
Closed on
Dec 2, 2005
Sold by
Milligan William T and Milligan Sandra J
Bought by
Parravano Vincent M and Parravano Margaret M
Current Estimated Value
Home Financials for this Owner
Home Financials are based on the most recent Mortgage that was taken out on this home.
Original Mortgage
$200,000
Interest Rate
8.3%
Mortgage Type
Purchase Money Mortgage
Purchase Details
Closed on
Sep 17, 2000
Sold by
Courtland Homes Inc
Bought by
Milligan William T and Milligan Sandra J
Home Financials for this Owner
Home Financials are based on the most recent Mortgage that was taken out on this home.
Original Mortgage
$176,300
Interest Rate
6.98%
Mortgage Type
New Conventional
Create a Home Valuation Report for This Property
The Home Valuation Report is an in-depth analysis detailing your home's value as well as a comparison with similar homes in the area
Home Values in the Area
Average Home Value in this Area
Purchase History
| Date | Buyer | Sale Price | Title Company |
|---|---|---|---|
| Parravano Vincent M | $450,000 | First American Title Ins Co | |
| Milligan William T | $185,314 | First American Title |
Source: Public Records
Mortgage History
| Date | Status | Borrower | Loan Amount |
|---|---|---|---|
| Open | Parravano Vincent M | $295,000 | |
| Closed | Parravano Vincent | $259,000 | |
| Closed | Parravano Vincent M | $200,000 | |
| Previous Owner | Milligan William T | $65,000 | |
| Previous Owner | Milligan William T | $37,000 | |
| Previous Owner | Milligan William T | $176,300 |
Source: Public Records
Tax History Compared to Growth
Tax History
| Year | Tax Paid | Tax Assessment Tax Assessment Total Assessment is a certain percentage of the fair market value that is determined by local assessors to be the total taxable value of land and additions on the property. | Land | Improvement |
|---|---|---|---|---|
| 2025 | $2,772 | $30,215 | -- | -- |
| 2024 | $2,815 | $28,776 | -- | -- |
| 2023 | $2,815 | $42,280 | $8,450 | $33,830 |
| 2022 | $2,730 | $31,950 | $6,390 | $25,560 |
| 2021 | $2,901 | $29,660 | $5,930 | $23,730 |
| 2020 | $2,756 | $28,630 | $5,720 | $22,910 |
| 2019 | $2,736 | $26,780 | $5,350 | $21,430 |
| 2018 | $2,345 | $26,060 | $5,210 | $20,850 |
| 2017 | $2,742 | $24,410 | $4,880 | $19,530 |
| 2016 | $2,257 | $23,720 | $4,740 | $18,980 |
| 2015 | $2,509 | $23,810 | $4,760 | $19,050 |
Source: Public Records
Map
Nearby Homes
- 9059 W Lake Pleasant Pkwy Unit G760
- 20476 N 88th Ln
- 9016 W Harmony Ln
- 20472 N 90th Ln
- 20477 N 91st Dr
- 9213 W Ross Ave
- 8761 W Mary Ann Dr
- 9143 W Harmony Ln
- 9186 W Clara Ln
- 9213 W Clara Ln
- 20501 N 93rd Ave
- 9225 W Clara Ln
- 20540 N 86th Ln
- 8729 W Tonopah Dr
- 8642 W Harmony Ln
- 9144 W Quail Ave
- 8752 W Lone Cactus Dr
- 9145 W Menadota Dr
- 9152 W Escuda Dr
- 9331 W Harmony Ln