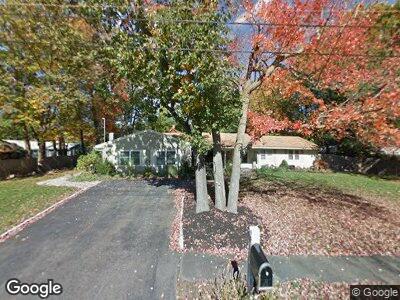
9 Montcastle Dr Chelmsford, MA 01824
Chelmsford Center NeighborhoodEstimated Value: $758,000 - $869,000
4
Beds
3
Baths
2,536
Sq Ft
$318/Sq Ft
Est. Value
About This Home
This home is located at 9 Montcastle Dr, Chelmsford, MA 01824 and is currently estimated at $806,018, approximately $317 per square foot. 9 Montcastle Dr is a home located in Middlesex County with nearby schools including South Row Elementary School, McCarthy Middle School, and Chelmsford High School.
Ownership History
Date
Name
Owned For
Owner Type
Purchase Details
Closed on
Aug 23, 2010
Sold by
Reim Jeffrey S and Reim Carly Connors
Bought by
Reim Jeffrey S and Connor-Reim Carlene R
Current Estimated Value
Home Financials for this Owner
Home Financials are based on the most recent Mortgage that was taken out on this home.
Original Mortgage
$256,519
Interest Rate
4.63%
Mortgage Type
Purchase Money Mortgage
Purchase Details
Closed on
Oct 17, 2003
Sold by
Blamy Ft and Blamy
Bought by
Reim Carly Connor and Reim Jeffrey S
Home Financials for this Owner
Home Financials are based on the most recent Mortgage that was taken out on this home.
Original Mortgage
$300,000
Interest Rate
6.43%
Mortgage Type
Purchase Money Mortgage
Create a Home Valuation Report for This Property
The Home Valuation Report is an in-depth analysis detailing your home's value as well as a comparison with similar homes in the area
Home Values in the Area
Average Home Value in this Area
Purchase History
| Date | Buyer | Sale Price | Title Company |
|---|---|---|---|
| Reim Jeffrey S | -- | -- | |
| Reim Jeffrey S | -- | -- | |
| Reim Carly Connor | $375,000 | -- | |
| Reim Carly Connor | $375,000 | -- |
Source: Public Records
Mortgage History
| Date | Status | Borrower | Loan Amount |
|---|---|---|---|
| Open | Reim Jeffrey S | $120,000 | |
| Open | Reim Jeffrey S | $245,000 | |
| Closed | Reim Jeffrey S | $256,519 | |
| Previous Owner | Connor-Reim Carlene R | $150,000 | |
| Previous Owner | Reim Jeffrey S | $300,000 | |
| Previous Owner | Reim Carly Connor | $300,000 | |
| Previous Owner | Reim Carlene Connor | $15,000 | |
| Previous Owner | Blamy Mary | $60,000 |
Source: Public Records
Tax History Compared to Growth
Tax History
| Year | Tax Paid | Tax Assessment Tax Assessment Total Assessment is a certain percentage of the fair market value that is determined by local assessors to be the total taxable value of land and additions on the property. | Land | Improvement |
|---|---|---|---|---|
| 2025 | $9,854 | $708,900 | $312,000 | $396,900 |
| 2024 | $8,969 | $658,500 | $312,000 | $346,500 |
| 2023 | $8,613 | $599,400 | $335,500 | $263,900 |
| 2022 | $8,519 | $540,200 | $289,700 | $250,500 |
| 2021 | $7,733 | $491,300 | $265,800 | $225,500 |
| 2020 | $7,493 | $455,500 | $224,700 | $230,800 |
| 2019 | $7,215 | $441,300 | $222,500 | $218,800 |
| 2018 | $7,435 | $414,000 | $200,400 | $213,600 |
| 2017 | $6,946 | $387,600 | $187,900 | $199,700 |
| 2016 | $6,978 | $387,000 | $182,500 | $204,500 |
| 2015 | $6,883 | $368,100 | $165,900 | $202,200 |
| 2014 | $6,673 | $351,600 | $157,500 | $194,100 |
Source: Public Records
Map
Nearby Homes
- 9 Acton Rd Unit 4
- 9 Acton Rd Unit 18
- 243 Riverneck Rd
- 8 Mill Rd
- 92 Stonegate Rd
- 8 Clover Hill Dr
- 134 Dalton Rd
- 5 Northgate Rd
- 215 Chelmsford St Unit 20
- 14 Green Valley Dr
- 13 Samuel Rd
- 95 Westford St
- 15 Sunset Ave
- 30 Ruthellen Rd
- 16 S Row St
- 6 Milestone Ave
- 222 Dalton Rd
- 7 Glen Ave Unit 1
- 181 Littleton Rd Unit 213
- 180 North Rd