Estimated Value: $978,292 - $1,286,000
4
Beds
3
Baths
4,032
Sq Ft
$278/Sq Ft
Est. Value
About This Home
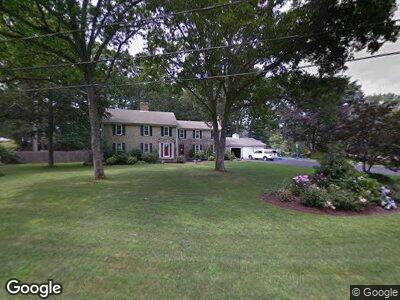
This home is located at 90 Bow St, East Greenwich, RI 02818 and is currently estimated at $1,119,764, approximately $277 per square foot. 90 Bow St is a home located in Kent County with nearby schools including James H. Eldredge Elementary School, East Greenwich High School, and Our Lady of Mercy School.
Ownership History
Date
Name
Owned For
Owner Type
Purchase Details
Closed on
Oct 24, 2008
Sold by
Fulton Michael and Fulton Virginia
Bought by
Sloan Stephan C and Sloan Lara A
Current Estimated Value
Home Financials for this Owner
Home Financials are based on the most recent Mortgage that was taken out on this home.
Original Mortgage
$508,000
Outstanding Balance
$360,042
Interest Rate
7%
Mortgage Type
Purchase Money Mortgage
Estimated Equity
$691,950
Create a Home Valuation Report for This Property
The Home Valuation Report is an in-depth analysis detailing your home's value as well as a comparison with similar homes in the area
Home Values in the Area
Average Home Value in this Area
Purchase History
| Date | Buyer | Sale Price | Title Company |
|---|---|---|---|
| Sloan Stephan C | $635,000 | -- |
Source: Public Records
Mortgage History
| Date | Status | Borrower | Loan Amount |
|---|---|---|---|
| Open | Tingley Otto | $508,000 | |
| Previous Owner | Tingley Otto | $322,000 | |
| Previous Owner | Tingley Otto | $227,000 |
Source: Public Records
Tax History Compared to Growth
Tax History
| Year | Tax Paid | Tax Assessment Tax Assessment Total Assessment is a certain percentage of the fair market value that is determined by local assessors to be the total taxable value of land and additions on the property. | Land | Improvement |
|---|---|---|---|---|
| 2024 | $12,466 | $846,300 | $292,600 | $553,700 |
| 2023 | $11,996 | $549,000 | $234,200 | $314,800 |
| 2022 | $11,760 | $549,000 | $234,200 | $314,800 |
| 2021 | $11,534 | $549,000 | $234,200 | $314,800 |
| 2020 | $12,762 | $544,700 | $212,800 | $331,900 |
| 2019 | $12,642 | $544,700 | $212,800 | $331,900 |
| 2018 | $12,528 | $544,700 | $212,800 | $331,900 |
| 2017 | $12,419 | $524,900 | $205,900 | $319,000 |
| 2016 | $12,645 | $524,900 | $205,900 | $319,000 |
| 2015 | $12,209 | $524,900 | $205,900 | $319,000 |
| 2014 | $12,339 | $530,500 | $206,900 | $323,600 |
Source: Public Records
Map
Nearby Homes
- 10 Trappers Ln
- 221 Cindyann Dr
- 429 Howland Rd
- 15 Cora St
- 20 Holly Hill Ct
- 426 Howland Rd
- 48 Birchwood Way
- 151 Pine Glen Dr
- 154 Pine Glen Dr
- 5 Eugene St
- 302 Kent Dr
- 4 Country Ct
- 177 Overfield Rd
- 5570 Post Rd Unit 10
- 1655 S County Trail
- 295 Frenchtown Rd
- 75 Overfield Rd
- 7 Cedar Rock Meadows
- 1404 S County Trail Unit 218
- 1300 Middle Rd