
Seller's Agent in 2021
Melissa Gittins
Purvis Property Management, INC
(540) 450-6070
2 Total Sales
Estimated Value: $561,437 - $614,000
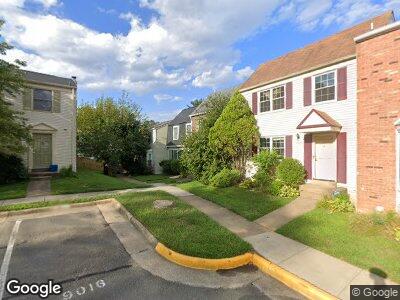
Ready for immediate occupancy! Show stopper gleaming hardwood floors in this 3 BR/2.5 BA townhome.
Enjoy additional outdoor living space on the brand new backyard patio with access from walk out basement. Lower level just upgraded to include new paint, new flooring and updated bathroom. All the bells and whistles of granite counters, stainless steel appliances, tile backsplash and designer cabinetry in the kitchen. Commuter friendly location just moments to the Vienna Metro and shopping/restaurants in the Mosaic District, Fairfax Circle and PanAm plus easy access to I-66, Routes 29 and 50! System humidifier and biannual HVAC checkups.
| Date | Buyer | Sale Price | Title Company |
|---|---|---|---|
| Reynolds Christopher R | -- | None Available | |
| Keefe Catherine D | $120,500 | -- |
| Date | Status | Borrower | Loan Amount |
|---|---|---|---|
| Open | Keefe Catherine | $165,000 | |
| Closed | Keefe Catherine D | $150,000 | |
| Closed | Keefe Catherine D | $96,400 |
| Date | Event | Price | Change | Sq Ft Price |
|---|---|---|---|---|
| 09/17/2021 09/17/21 | Rented | $2,450 | 0.0% | -- |
| 08/20/2021 08/20/21 | For Rent | $2,450 | -- | -- |
| Year | Tax Paid | Tax Assessment Tax Assessment Total Assessment is a certain percentage of the fair market value that is determined by local assessors to be the total taxable value of land and additions on the property. | Land | Improvement |
|---|---|---|---|---|
| 2024 | $5,862 | $506,020 | $165,000 | $341,020 |
| 2023 | $5,710 | $506,020 | $165,000 | $341,020 |
| 2022 | $5,248 | $458,920 | $150,000 | $308,920 |
| 2021 | $5,012 | $427,090 | $135,000 | $292,090 |
| 2020 | $4,851 | $409,880 | $132,000 | $277,880 |
| 2019 | $4,653 | $393,190 | $126,000 | $267,190 |
| 2018 | $4,422 | $384,540 | $120,000 | $264,540 |
| 2017 | $4,281 | $368,710 | $116,000 | $252,710 |
| 2016 | $4,145 | $357,750 | $110,000 | $247,750 |
| 2015 | $3,943 | $353,300 | $108,000 | $245,300 |
| 2014 | $3,773 | $338,870 | $103,000 | $235,870 |
Seller's Agent in 2021
Melissa Gittins
Purvis Property Management, INC
(540) 450-6070
2 Total Sales
Buyer's Agent in 2021
Randall Scruggs
My Guardian Agent LC
(571) 246-3333
18 Total Sales