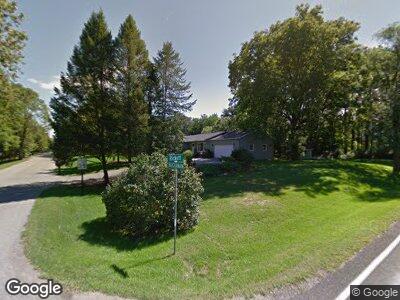
9018 Buchanan Rd Brighton, MI 48116
Estimated Value: $357,000 - $414,000
3
Beds
2
Baths
1,650
Sq Ft
$232/Sq Ft
Est. Value
About This Home
This home is located at 9018 Buchanan Rd, Brighton, MI 48116 and is currently estimated at $382,244, approximately $231 per square foot. 9018 Buchanan Rd is a home located in Livingston County with nearby schools including Hawkins Elementary School, Scranton Middle School, and Brighton High School.
Ownership History
Date
Name
Owned For
Owner Type
Purchase Details
Closed on
Jul 12, 2019
Sold by
Klump Edward W and Klump Jennifer
Bought by
Haapala Aaron and Haapala Kayla
Current Estimated Value
Home Financials for this Owner
Home Financials are based on the most recent Mortgage that was taken out on this home.
Original Mortgage
$209,000
Interest Rate
3.82%
Mortgage Type
Stand Alone Refi Refinance Of Original Loan
Purchase Details
Closed on
Jul 10, 2019
Sold by
Klump Edward W and Klump Jennifer
Bought by
Haapala Aaron and Haapala Kayla
Home Financials for this Owner
Home Financials are based on the most recent Mortgage that was taken out on this home.
Original Mortgage
$209,000
Interest Rate
3.82%
Mortgage Type
Stand Alone Refi Refinance Of Original Loan
Purchase Details
Closed on
Dec 5, 2003
Sold by
Klump Edward W
Bought by
Klump Edward W and Klump Jennifer
Home Financials for this Owner
Home Financials are based on the most recent Mortgage that was taken out on this home.
Original Mortgage
$160,000
Interest Rate
6.37%
Mortgage Type
Purchase Money Mortgage
Create a Home Valuation Report for This Property
The Home Valuation Report is an in-depth analysis detailing your home's value as well as a comparison with similar homes in the area
Home Values in the Area
Average Home Value in this Area
Purchase History
| Date | Buyer | Sale Price | Title Company |
|---|---|---|---|
| Haapala Aaron | $220,000 | First American Title | |
| Haapala Aaron | $220,000 | First American Title | |
| Klump Edward W | -- | -- | |
| Klump Edward W | $200,000 | -- |
Source: Public Records
Mortgage History
| Date | Status | Borrower | Loan Amount |
|---|---|---|---|
| Open | Haapala Aaron | $75,000 | |
| Open | Haapala Aaron | $220,500 | |
| Closed | Haapala Aaron | $209,000 | |
| Closed | Haapala Aaron | $209,000 | |
| Previous Owner | Klump Edward W | $160,000 |
Source: Public Records
Tax History Compared to Growth
Tax History
| Year | Tax Paid | Tax Assessment Tax Assessment Total Assessment is a certain percentage of the fair market value that is determined by local assessors to be the total taxable value of land and additions on the property. | Land | Improvement |
|---|---|---|---|---|
| 2024 | $1,735 | $173,600 | $0 | $0 |
| 2023 | $1,659 | $153,500 | $0 | $0 |
| 2022 | $3,385 | $123,600 | $0 | $0 |
| 2021 | $3,385 | $122,000 | $0 | $0 |
| 2020 | $3,539 | $126,800 | $0 | $0 |
| 2019 | $2,319 | $123,600 | $0 | $0 |
| 2018 | $2,278 | $112,200 | $0 | $0 |
| 2017 | $2,240 | $112,500 | $0 | $0 |
| 2016 | $2,229 | $113,000 | $0 | $0 |
| 2014 | $2,058 | $88,500 | $0 | $0 |
| 2012 | $2,058 | $74,200 | $0 | $0 |
Source: Public Records
Map
Nearby Homes
- Lot 12 Wyndam Ln
- 8854 Buchanan Rd
- 8537 Saddlewood Dr Unit 24
- 8912 Mission Dr
- 0 Fieldcrest Dr Unit 20250009935
- 202 Woodfield Square Ln
- 2245 Willow Tree Dr Unit 43
- 0000 Dibrova Dr
- 7915 Goldenrod Ct
- 432 Water Tower Cir Unit 75
- 400 Spring Brooke Dr
- 2250 Willow Tree Dr
- 419 Water Tower Cir
- 1016 Pinewood Ct Unit 48
- 1000 Pinewood Ct
- 1057 Peppergrove Dr
- 941 Persimmon Dr
- 7822 Bishop Rd
- 0000 Grand River Ave
- 6240 Northridge Hills Dr