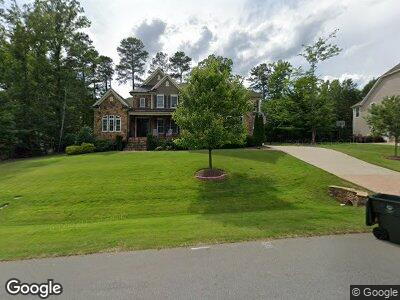
9027 Concord Hill Ct Raleigh, NC 27613
Estimated Value: $1,248,000 - $1,375,000
6
Beds
5
Baths
4,377
Sq Ft
$300/Sq Ft
Est. Value
About This Home
This home is located at 9027 Concord Hill Ct, Raleigh, NC 27613 and is currently estimated at $1,311,320, approximately $299 per square foot. 9027 Concord Hill Ct is a home located in Wake County with nearby schools including Leesville Road Middle School, Leesville Road High School, and Quest Academy.
Ownership History
Date
Name
Owned For
Owner Type
Purchase Details
Closed on
Nov 5, 2018
Sold by
Dunphy James J and Dunphy Kimberly A
Bought by
Paula O Dwyer Brian F and Dwyer Paula O
Current Estimated Value
Home Financials for this Owner
Home Financials are based on the most recent Mortgage that was taken out on this home.
Original Mortgage
$302,816
Interest Rate
4.6%
Mortgage Type
Commercial
Purchase Details
Closed on
Jul 31, 2012
Sold by
Weekley Homes Llc
Bought by
Dunphy James J and Dunphy Kimberly A
Home Financials for this Owner
Home Financials are based on the most recent Mortgage that was taken out on this home.
Original Mortgage
$417,000
Interest Rate
3.72%
Mortgage Type
New Conventional
Purchase Details
Closed on
Jun 23, 2011
Sold by
The Larry Smith Company
Bought by
Weekley Homes Lp
Create a Home Valuation Report for This Property
The Home Valuation Report is an in-depth analysis detailing your home's value as well as a comparison with similar homes in the area
Home Values in the Area
Average Home Value in this Area
Purchase History
| Date | Buyer | Sale Price | Title Company |
|---|---|---|---|
| Paula O Dwyer Brian F | $840,000 | None Available | |
| Dunphy James J | $635,000 | None Available | |
| Weekley Homes Lp | $1,200,000 | None Available |
Source: Public Records
Mortgage History
| Date | Status | Borrower | Loan Amount |
|---|---|---|---|
| Open | Odwyer Brian F | $427,000 | |
| Closed | Paula O Dwyer Brian F | $302,816 | |
| Closed | Paula O Dwyer Brian F | $453,100 | |
| Previous Owner | Dunphy Kimberly A | $126,000 | |
| Previous Owner | Dunphy James J | $417,000 |
Source: Public Records
Tax History Compared to Growth
Tax History
| Year | Tax Paid | Tax Assessment Tax Assessment Total Assessment is a certain percentage of the fair market value that is determined by local assessors to be the total taxable value of land and additions on the property. | Land | Improvement |
|---|---|---|---|---|
| 2024 | $9,388 | $1,078,671 | $225,000 | $853,671 |
| 2023 | $9,366 | $857,472 | $180,000 | $677,472 |
| 2022 | $8,702 | $857,472 | $180,000 | $677,472 |
| 2021 | $8,363 | $857,472 | $180,000 | $677,472 |
| 2020 | $8,211 | $857,472 | $180,000 | $677,472 |
| 2019 | $8,312 | $715,465 | $140,000 | $575,465 |
| 2018 | $7,837 | $715,465 | $140,000 | $575,465 |
| 2017 | $7,463 | $715,465 | $140,000 | $575,465 |
| 2016 | $7,309 | $715,465 | $140,000 | $575,465 |
| 2015 | $8,224 | $792,318 | $152,000 | $640,318 |
| 2014 | -- | $792,318 | $152,000 | $640,318 |
Source: Public Records
Map
Nearby Homes
- 3900 Maplefield Dr
- 11801 Strickland Rd
- 12801 Strickland Rd
- 12808 Edsel Dr
- 9400 Rawson Ave
- 12833 Edsel Dr
- 9417 Rawson Ave
- 9413 Rawson Ave
- 12817 Strickland Rd
- 12812 Baybriar Dr
- 12908 Grey Willow Dr
- 12912 Grey Willow Dr
- 8326 Ray Rd
- 8701 Oneal Rd
- 3402 Brady Hollow Way
- 8418 Wheatstone Ln
- 9305 Field Maple Ct
- 9309 Field Maple Ct
- 4533 Wood Valley Dr
- 8713 Gleneagles Dr