
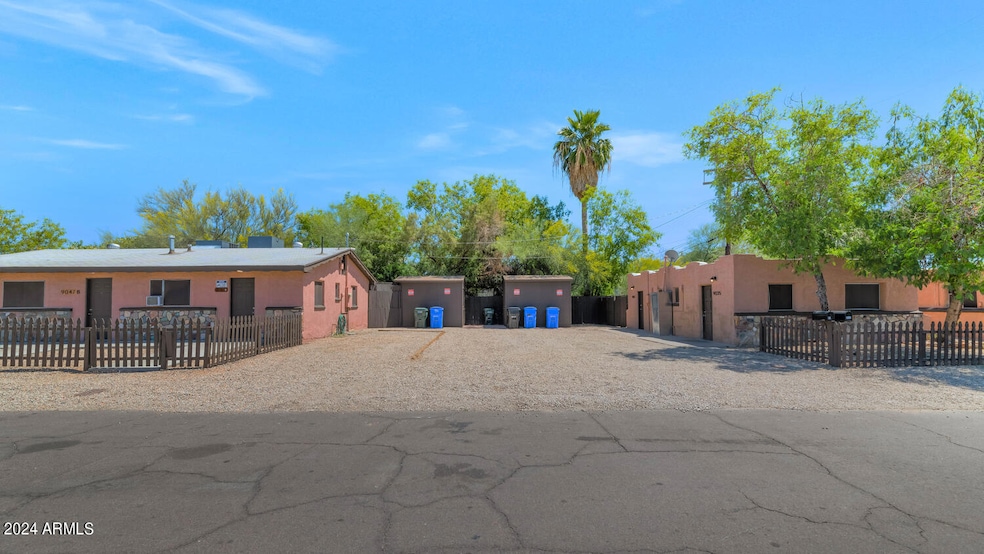
9033 N 11th St Phoenix, AZ 85020
North Central Neighborhood
--
Bed
--
Bath
806
Sq Ft
3,441
Sq Ft Lot
Highlights
- Cooling Available
- Ceramic Tile Flooring
- Individual Controls for Heating
- Sunnyslope High School Rated A
- Ceiling Fan
About This Home
As of December 2024ET''S BE CLEAR THIS IS A 2 UNIT Property and YOU MUST BUY THE FOURPLEX NEXT DOOR. See the listing at 9047 N 11 St concurrently. The numbers are accurate and Tenants are Government Assisted Leases. Please see the Supplemental Remarks for all information. Drive by only. NO FHA OR VA LOANS but you could buy both properties using two separate Residential Loans or both with a Commercial Loan. Should be able to buy with a DCR loan as well. Buyer to verify all facts and figures Fully Occupied: All 6 units leased, ensuring stable rental income.
9.12% Cap Rate: High-yield returns outperform industry standards.
Prime Location: Close to schools, parks, shopping centers, and public transit.
Tenant Amenities: Includes storage rooms and private backyards for select units.
Property Details
Home Type
- Multi-Family
Est. Annual Taxes
- $558
Year Built
- Built in 1958
Lot Details
- Additional Parcels
Home Design
- Composition Roof
- Block Exterior
- Stucco
Interior Spaces
- Ceiling Fan
- Ceramic Tile Flooring
Parking
- 4 Open Parking Spaces
- 4 Parking Spaces
- On-Street Parking
Utilities
- Cooling Available
- Individual Controls for Heating
- Master Water Meter
Listing and Financial Details
- Tenant pays for cable TV
- The owner pays for gas, electricity, trash collection, water, sewer, landscaping
- Tax Lot 30
- Assessor Parcel Number 159-35-112
Community Details
Overview
- 2 Units
- Building Dimensions are irr
- Waltmore Subdivision
Building Details
- Operating Expense $8,959
- Gross Income $39,169
- Net Operating Income $30,442
Map
Create a Home Valuation Report for This Property
The Home Valuation Report is an in-depth analysis detailing your home's value as well as a comparison with similar homes in the area
Home Values in the Area
Average Home Value in this Area
Property History
| Date | Event | Price | Change | Sq Ft Price |
|---|---|---|---|---|
| 12/11/2024 12/11/24 | Sold | $360,000 | -64.0% | $447 / Sq Ft |
| 12/06/2024 12/06/24 | Sold | $999,000 | 0.0% | $1,239 / Sq Ft |
| 11/11/2024 11/11/24 | Pending | -- | -- | -- |
| 11/11/2024 11/11/24 | Pending | -- | -- | -- |
| 11/05/2024 11/05/24 | For Sale | $999,000 | +199.1% | $1,239 / Sq Ft |
| 11/05/2024 11/05/24 | For Sale | $334,000 | -66.6% | $414 / Sq Ft |
| 10/27/2024 10/27/24 | Pending | -- | -- | -- |
| 10/27/2024 10/27/24 | Pending | -- | -- | -- |
| 10/18/2024 10/18/24 | Price Changed | $999,000 | +199.1% | $1,239 / Sq Ft |
| 10/18/2024 10/18/24 | Price Changed | $334,000 | -4.3% | $414 / Sq Ft |
| 10/02/2024 10/02/24 | Price Changed | $349,000 | -0.3% | $433 / Sq Ft |
| 09/11/2024 09/11/24 | For Sale | $350,000 | -66.6% | $434 / Sq Ft |
| 09/08/2024 09/08/24 | Price Changed | $1,049,000 | +0.4% | $1,301 / Sq Ft |
| 09/07/2024 09/07/24 | Price Changed | $1,045,000 | -2.3% | $1,297 / Sq Ft |
| 08/02/2024 08/02/24 | For Sale | $1,070,000 | 0.0% | $1,328 / Sq Ft |
| 07/22/2024 07/22/24 | Pending | -- | -- | -- |
| 07/20/2024 07/20/24 | Price Changed | $1,070,000 | -2.3% | $1,328 / Sq Ft |
| 06/18/2024 06/18/24 | For Sale | $1,095,000 | 0.0% | $1,359 / Sq Ft |
| 05/03/2024 05/03/24 | Pending | -- | -- | -- |
| 04/18/2024 04/18/24 | For Sale | $1,095,000 | -- | $1,359 / Sq Ft |
Source: Arizona Regional Multiple Listing Service (ARMLS)
Tax History
| Year | Tax Paid | Tax Assessment Tax Assessment Total Assessment is a certain percentage of the fair market value that is determined by local assessors to be the total taxable value of land and additions on the property. | Land | Improvement |
|---|---|---|---|---|
| 2025 | $559 | $4,569 | -- | -- |
| 2024 | $549 | $4,351 | -- | -- |
| 2023 | $549 | $16,060 | $3,210 | $12,850 |
| 2022 | $531 | $11,470 | $2,290 | $9,180 |
| 2021 | $538 | $9,760 | $1,950 | $7,810 |
| 2020 | $524 | $8,480 | $1,690 | $6,790 |
| 2019 | $515 | $7,360 | $1,470 | $5,890 |
| 2018 | $501 | $6,220 | $1,240 | $4,980 |
| 2017 | $499 | $5,010 | $1,000 | $4,010 |
| 2016 | $490 | $4,450 | $890 | $3,560 |
| 2015 | $453 | $3,700 | $740 | $2,960 |
Source: Public Records
Mortgage History
| Date | Status | Loan Amount | Loan Type |
|---|---|---|---|
| Open | $270,000 | New Conventional | |
| Closed | $270,000 | New Conventional | |
| Previous Owner | $175,000 | New Conventional | |
| Previous Owner | $292,500 | Construction |
Source: Public Records
Deed History
| Date | Type | Sale Price | Title Company |
|---|---|---|---|
| Warranty Deed | $360,000 | Wfg National Title Insurance C | |
| Warranty Deed | $360,000 | Wfg National Title Insurance C | |
| Warranty Deed | -- | Empire Title Agency | |
| Warranty Deed | $250,000 | Empire Title Agency | |
| Cash Sale Deed | $65,000 | Chicago Title Agency Inc |
Source: Public Records
Similar Homes in Phoenix, AZ
Source: Arizona Regional Multiple Listing Service (ARMLS)
MLS Number: 6755715
APN: 159-35-112A
Disclaimer: Certain information contained herein is derived from information provided by parties other than Homes.com. All information provided is deemed reliable, but is not guaranteed to be accurate and should be independently verified.
![]() All information should be verified by the recipient and none is guaranteed as accurate by ARMLS
All information should be verified by the recipient and none is guaranteed as accurate by ARMLS
Listing Information presented by local MLS brokerage: Ten-X, local REALTOR®- Arlene Richardson - (888)-952-6393
Nearby Homes
- 9028 N 11th St
- 9043 N 10th St
- 1112 E Dunlap Ave
- 1141 E Eva St
- 918 E Dunlap Ave
- 918 E Dunlap Ave Unit 1-2
- 9202 N 12th St
- 9239 N Cave Creek Rd
- 8916 N 11th St
- 9201 N 12th St
- 8915 N 9th Place
- 8939 N 8th St
- 801 E Dunlap Ave
- 1224 E Dunlap Ave
- 9505 N Cave Creek Rd
- 9017 N Cave Creek Rd
- 9105 N 13th St
- 8861 N 12th Place Unit 49
- 1205 E Townley Ave
- 748 E Carol Ave