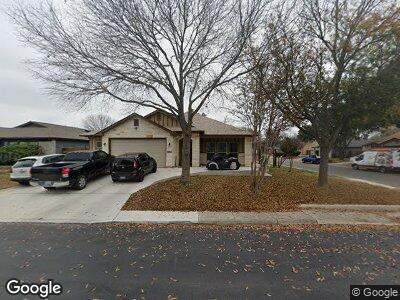
9042 Koenig San Antonio, TX 78251
Westover Hills NeighborhoodEstimated Value: $318,000 - $338,000
3
Beds
3
Baths
2,629
Sq Ft
$126/Sq Ft
Est. Value
About This Home
This home is located at 9042 Koenig, San Antonio, TX 78251 and is currently estimated at $330,490, approximately $125 per square foot. 9042 Koenig is a home located in Bexar County with nearby schools including Evers Elementary School, Jordan Middle, and Warren High School.
Ownership History
Date
Name
Owned For
Owner Type
Purchase Details
Closed on
Jan 20, 2011
Sold by
Schoeppel Shirley K and Schoeppel James A
Bought by
Schoeppel Shirley K and Schoeppel James A
Current Estimated Value
Home Financials for this Owner
Home Financials are based on the most recent Mortgage that was taken out on this home.
Original Mortgage
$83,195
Interest Rate
3%
Mortgage Type
VA
Purchase Details
Closed on
Jul 14, 2000
Sold by
Thompson Christopher M and Thompson Susan G
Bought by
Schoeppel James A and Shaner Schoeppel Shirley K
Home Financials for this Owner
Home Financials are based on the most recent Mortgage that was taken out on this home.
Original Mortgage
$99,900
Interest Rate
8.56%
Mortgage Type
VA
Purchase Details
Closed on
Jun 20, 1994
Sold by
Rayco Ltd
Bought by
Thompson Christopher M and Thompson Susan G
Home Financials for this Owner
Home Financials are based on the most recent Mortgage that was taken out on this home.
Original Mortgage
$103,201
Interest Rate
8.75%
Mortgage Type
Assumption
Create a Home Valuation Report for This Property
The Home Valuation Report is an in-depth analysis detailing your home's value as well as a comparison with similar homes in the area
Home Values in the Area
Average Home Value in this Area
Purchase History
| Date | Buyer | Sale Price | Title Company |
|---|---|---|---|
| Schoeppel Shirley K | -- | National Title Network Inc | |
| Schoeppel James A | -- | Chicago Title | |
| Thompson Christopher M | -- | -- |
Source: Public Records
Mortgage History
| Date | Status | Borrower | Loan Amount |
|---|---|---|---|
| Open | Schoeppel Shirley K | $85,375 | |
| Closed | Schoeppel Shirley K | $83,195 | |
| Closed | Schoeppel James A | $105,000 | |
| Closed | Schoeppel James A | $99,900 | |
| Previous Owner | Thompson Christopher M | $103,201 |
Source: Public Records
Tax History Compared to Growth
Tax History
| Year | Tax Paid | Tax Assessment Tax Assessment Total Assessment is a certain percentage of the fair market value that is determined by local assessors to be the total taxable value of land and additions on the property. | Land | Improvement |
|---|---|---|---|---|
| 2023 | $51 | $300,000 | $52,040 | $247,960 |
| 2022 | $8,054 | $325,360 | $42,710 | $282,650 |
| 2021 | $995 | $38,830 | $38,830 | $0 |
| 2020 | $5,900 | $226,150 | $28,070 | $198,080 |
| 2019 | $6,015 | $224,550 | $28,070 | $196,480 |
| 2018 | $5,722 | $213,470 | $28,070 | $185,400 |
| 2017 | $5,238 | $195,080 | $28,070 | $167,010 |
| 2016 | $5,000 | $186,186 | $28,070 | $163,860 |
| 2015 | $3,054 | $169,260 | $23,470 | $145,790 |
| 2014 | $3,054 | $158,510 | $0 | $0 |
Source: Public Records
Map
Nearby Homes
- 9046 Mansfield
- 8935 Fabens
- 1435 Butler Dr
- 8915 Mansfield
- 8907 Athens
- 8714 Yormis Nest
- 1226 Silverway
- 8727 Narva Plain
- 1123 Richland Hills Dr
- 2203 Loska Manor
- 8703 Jogeva Way
- 8626 Kardla Forest
- 2722 Johnson Grass
- 2722 Sage Hollow
- 9518 Vanderpool St
- 2814 Meadow River
- 9431 Massaro St
- 9511 Rio Frio
- 8207 Shallow Creek Dr
- 7906 Herder Cir