9081 Snowden River Pkwy Columbia, MD 21046
Estimated Value: $5,909,450
--
Bed
--
Bath
7,597
Sq Ft
$778/Sq Ft
Est. Value
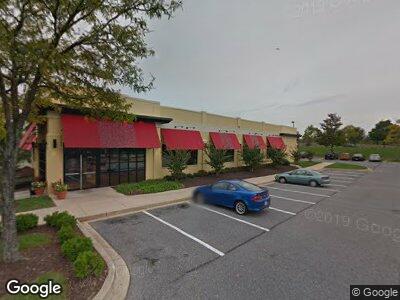
About This Home
This home is located at 9081 Snowden River Pkwy, Columbia, MD 21046 and is currently estimated at $5,909,450, approximately $777 per square foot. 9081 Snowden River Pkwy is a home located in Howard County with nearby schools including Cradlerock Elementary, Lake Elkhorn Middle School, and Oakland Mills High School.
Ownership History
Date
Name
Owned For
Owner Type
Purchase Details
Closed on
Oct 9, 2008
Sold by
Robb Paul
Bought by
Snowden Holdings Llc
Current Estimated Value
Home Financials for this Owner
Home Financials are based on the most recent Mortgage that was taken out on this home.
Original Mortgage
$3,184,800
Outstanding Balance
$2,196,202
Interest Rate
6.54%
Estimated Equity
$3,755,708
Purchase Details
Closed on
Sep 19, 2008
Sold by
Robb Paul
Bought by
Snowden Holdings Llc
Home Financials for this Owner
Home Financials are based on the most recent Mortgage that was taken out on this home.
Original Mortgage
$3,184,800
Outstanding Balance
$2,196,202
Interest Rate
6.54%
Estimated Equity
$3,755,708
Purchase Details
Closed on
Oct 8, 2003
Sold by
Ge Capital Franchise Finance Corp
Bought by
Robb Paul
Purchase Details
Closed on
Apr 7, 2003
Sold by
Bertuccis Restaurant Inc
Bought by
Ge Capital Franchise Finance Corp
Create a Home Valuation Report for This Property
The Home Valuation Report is an in-depth analysis detailing your home's value as well as a comparison with similar homes in the area
Home Values in the Area
Average Home Value in this Area
Purchase History
| Date | Buyer | Sale Price | Title Company |
|---|---|---|---|
| Snowden Holdings Llc | $3,981,000 | -- | |
| Snowden Holdings Llc | $3,981,000 | -- | |
| Robb Paul | $3,182,148 | -- | |
| Ge Capital Franchise Finance Corp | $2,750,000 | -- |
Source: Public Records
Mortgage History
| Date | Status | Borrower | Loan Amount |
|---|---|---|---|
| Open | Snowden Holdings Llc | $3,184,800 | |
| Closed | Snowden Holdings Llc | $3,184,800 |
Source: Public Records
Tax History Compared to Growth
Tax History
| Year | Tax Paid | Tax Assessment Tax Assessment Total Assessment is a certain percentage of the fair market value that is determined by local assessors to be the total taxable value of land and additions on the property. | Land | Improvement |
|---|---|---|---|---|
| 2024 | $58,901 | $3,730,167 | $0 | $0 |
| 2023 | $55,616 | $3,679,933 | $0 | $0 |
| 2022 | $54,879 | $3,629,700 | $2,432,400 | $1,197,300 |
| 2021 | $27,645 | $3,576,400 | $0 | $0 |
| 2020 | $53,362 | $3,523,100 | $0 | $0 |
| 2019 | $52,596 | $3,469,800 | $2,432,400 | $1,037,400 |
| 2018 | $50,691 | $3,469,800 | $2,432,400 | $1,037,400 |
| 2017 | $50,515 | $3,469,800 | $0 | $0 |
| 2016 | $12,095 | $3,568,300 | $0 | $0 |
| 2015 | $12,095 | $3,557,433 | $0 | $0 |
| 2014 | $12,058 | $3,546,567 | $0 | $0 |
Source: Public Records
Map
Nearby Homes
- 6924 Catwing Ct
- 9239 Feathered Head
- 9350 Gentle Folk
- 7278 Procopio Cir
- 7201 Procopio Cir
- 7208 Procopio Cir
- 9204 Adalee Ct
- 7035 Ivoryhand Place
- 7140 Winter Rose Path
- 7331 Better Hours Ct
- 8831 Shining Oceans Way
- 7325 Carved Stone
- 7451 Oakland Mills Rd
- 8833 Warm Granite Dr
- 9531 Rommel Dr
- 6508 Smokehouse Ct
- 6422 Pound Apple Ct
- 8718 Endless Ocean Way
- 6912 Bugledrum Way
- 6413 Sewells Orchard Dr