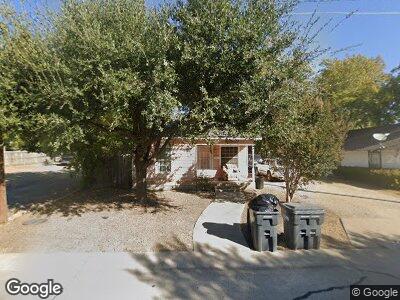
909 Anthony St McKinney, TX 75069
Mouzon NeighborhoodEstimated Value: $204,573 - $322,000
--
Bed
--
Bath
834
Sq Ft
$315/Sq Ft
Est. Value
About This Home
This home is located at 909 Anthony St, McKinney, TX 75069 and is currently estimated at $262,893, approximately $315 per square foot. 909 Anthony St is a home located in Collin County with nearby schools including Webb Elementary School, Scott Morgan Johnson Middle School, and Mckinney North High School.
Ownership History
Date
Name
Owned For
Owner Type
Purchase Details
Closed on
Sep 29, 2017
Sold by
Thibodeaux David J
Bought by
Elizando Cheryl Marie
Current Estimated Value
Home Financials for this Owner
Home Financials are based on the most recent Mortgage that was taken out on this home.
Original Mortgage
$13,207
Outstanding Balance
$11,286
Interest Rate
3.89%
Mortgage Type
Purchase Money Mortgage
Estimated Equity
$222,118
Purchase Details
Closed on
Apr 23, 1997
Sold by
Five Gems Ltd
Bought by
Thibodeaux David J
Home Financials for this Owner
Home Financials are based on the most recent Mortgage that was taken out on this home.
Original Mortgage
$23,143
Interest Rate
7.82%
Mortgage Type
Seller Take Back
Purchase Details
Closed on
Dec 3, 1996
Sold by
Niendorff Carl
Bought by
Five Gems Ltd
Create a Home Valuation Report for This Property
The Home Valuation Report is an in-depth analysis detailing your home's value as well as a comparison with similar homes in the area
Home Values in the Area
Average Home Value in this Area
Purchase History
| Date | Buyer | Sale Price | Title Company |
|---|---|---|---|
| Elizando Cheryl Marie | -- | None Available | |
| Thibodeaux David J | -- | -- | |
| Five Gems Ltd | $8,000 | -- |
Source: Public Records
Mortgage History
| Date | Status | Borrower | Loan Amount |
|---|---|---|---|
| Open | Elizando Cheryl Marie | $13,207 | |
| Previous Owner | Thibodeaux David J | $23,143 |
Source: Public Records
Tax History Compared to Growth
Tax History
| Year | Tax Paid | Tax Assessment Tax Assessment Total Assessment is a certain percentage of the fair market value that is determined by local assessors to be the total taxable value of land and additions on the property. | Land | Improvement |
|---|---|---|---|---|
| 2023 | $2,099 | $98,742 | $57,000 | $41,742 |
| 2022 | $1,885 | $94,073 | $57,000 | $37,073 |
| 2021 | $1,398 | $65,829 | $36,000 | $29,829 |
| 2020 | $1,450 | $64,162 | $36,000 | $28,162 |
| 2019 | $1,516 | $63,778 | $30,000 | $33,778 |
| 2018 | $1,232 | $50,634 | $24,000 | $26,634 |
| 2017 | $837 | $34,414 | $14,220 | $20,194 |
| 2016 | $681 | $27,441 | $10,428 | $17,013 |
| 2015 | $471 | $23,510 | $9,480 | $14,030 |
Source: Public Records
Map
Nearby Homes