
Seller's Agent in 2024
Ronald Dolenti
Queenston Realty, LLC
(215) 983-6263
8 in this area
48 Total Sales
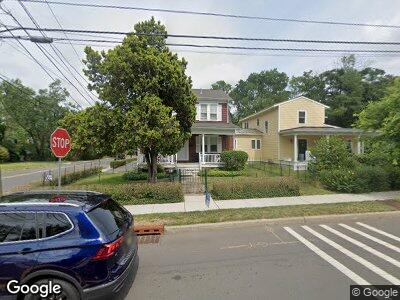
Nestled in the heart of downtown Princeton, New Jersey, 91 Linden Lane is a beautifully renovated residence offering modern comforts and classic appeal. This charming home features three spacious bedrooms and two full bathrooms, ideal for family living. The updated kitchen boasts contemporary finishes and appliances, perfect for culinary enthusiasts. With three off-street parking spaces, convenience is assured—a rare find in this bustling area. Just a block from local schools and two blocks from the vibrant Nassau Street, you'll enjoy easy access to Princeton's finest shops, restaurants, and cultural attractions. Don't miss the chance to call this delightful property your new home and embrace the vibrant Princeton lifestyle.
| Date | Buyer | Sale Price | Title Company |
|---|---|---|---|
| Langford John T | $500,000 | Surety Title Co | |
| Quap Maureen | $523,000 | Old Republic National Title |
| Date | Status | Borrower | Loan Amount |
|---|---|---|---|
| Open | Langford John T | $414,213 | |
| Closed | Langford John T | $424,000 | |
| Closed | Quap Maureen | $417,000 | |
| Previous Owner | Quap Maureen | $88,000 | |
| Previous Owner | Quap Maureen | $417,000 |
| Date | Event | Price | Change | Sq Ft Price |
|---|---|---|---|---|
| 07/31/2024 07/31/24 | Rented | $4,500 | 0.0% | -- |
| 06/10/2024 06/10/24 | Under Contract | -- | -- | -- |
| 05/31/2024 05/31/24 | For Rent | $4,500 | +40.6% | -- |
| 02/13/2017 02/13/17 | Rented | $3,200 | -8.6% | -- |
| 02/10/2017 02/10/17 | Under Contract | -- | -- | -- |
| 01/02/2017 01/02/17 | For Rent | $3,500 | 0.0% | -- |
| 08/13/2015 08/13/15 | Sold | $490,000 | -5.4% | -- |
| 07/07/2015 07/07/15 | Pending | -- | -- | -- |
| 07/07/2015 07/07/15 | For Sale | $518,000 | 0.0% | -- |
| 04/03/2015 04/03/15 | Price Changed | $518,000 | -7.3% | -- |
| 02/14/2015 02/14/15 | Price Changed | $559,000 | -6.7% | -- |
| 11/10/2014 11/10/14 | For Sale | $599,000 | +18.1% | -- |
| 04/10/2012 04/10/12 | Sold | $507,000 | -10.6% | $437 / Sq Ft |
| 01/23/2012 01/23/12 | Pending | -- | -- | -- |
| 10/17/2011 10/17/11 | Price Changed | $567,000 | -4.7% | $489 / Sq Ft |
| 09/29/2011 09/29/11 | For Sale | $595,000 | -- | $513 / Sq Ft |
| Year | Tax Paid | Tax Assessment Tax Assessment Total Assessment is a certain percentage of the fair market value that is determined by local assessors to be the total taxable value of land and additions on the property. | Land | Improvement |
|---|---|---|---|---|
| 2024 | $13,012 | $517,600 | $325,000 | $192,600 |
| 2023 | $13,012 | $517,600 | $325,000 | $192,600 |
| 2022 | $12,588 | $517,600 | $325,000 | $192,600 |
| 2021 | $12,624 | $517,600 | $325,000 | $192,600 |
| 2020 | $12,526 | $517,600 | $325,000 | $192,600 |
| 2019 | $12,277 | $517,600 | $325,000 | $192,600 |
| 2018 | $12,304 | $527,600 | $335,000 | $192,600 |
| 2017 | $12,135 | $527,600 | $335,000 | $192,600 |
| 2016 | $10,826 | $478,200 | $335,000 | $143,200 |
Seller's Agent in 2024
Ronald Dolenti
Queenston Realty, LLC
(215) 983-6263
8 in this area
48 Total Sales
d
Buyer's Agent in 2024
datacorrect BrightMLS
Non Subscribing Office
Seller's Agent in 2017
Doug Gibbons
RE/MAX
(609) 439-6571
24 Total Sales
Buyer's Agent in 2017
Sylmarie Trowbridge
Callaway Henderson Sotheby's Int'l-Princeton
(917) 386-5880
12 in this area
44 Total Sales
Seller's Agent in 2015
Owen Toland
Callaway Henderson Sotheby's Int'l-Princeton
(609) 731-5953
6 in this area
28 Total Sales
Seller's Agent in 2012
Jack Yao
Realmart Realty, LLC
(732) 727-2280
3 in this area
221 Total Sales