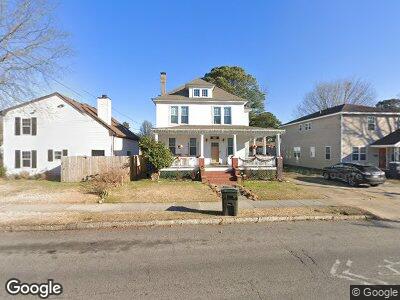
9110 Granby St Norfolk, VA 23503
Northside NeighborhoodEstimated Value: $339,000 - $404,093
6
Beds
2
Baths
2,502
Sq Ft
$150/Sq Ft
Est. Value
About This Home
This home is located at 9110 Granby St, Norfolk, VA 23503 and is currently estimated at $376,523, approximately $150 per square foot. 9110 Granby St is a home located in Norfolk City with nearby schools including Mary Calcott Elementary School, Northside Middle School, and Granby High School.
Ownership History
Date
Name
Owned For
Owner Type
Purchase Details
Closed on
Mar 15, 2021
Sold by
Tamburino Kimberly L
Bought by
Roberts Jamie Elaine
Current Estimated Value
Home Financials for this Owner
Home Financials are based on the most recent Mortgage that was taken out on this home.
Original Mortgage
$262,286
Outstanding Balance
$239,356
Interest Rate
2.7%
Mortgage Type
New Conventional
Estimated Equity
$132,064
Create a Home Valuation Report for This Property
The Home Valuation Report is an in-depth analysis detailing your home's value as well as a comparison with similar homes in the area
Home Values in the Area
Average Home Value in this Area
Purchase History
| Date | Buyer | Sale Price | Title Company |
|---|---|---|---|
| Roberts Jamie Elaine | $210,000 | Attorney |
Source: Public Records
Mortgage History
| Date | Status | Borrower | Loan Amount |
|---|---|---|---|
| Open | Roberts Jamie Elaine | $262,286 | |
| Previous Owner | Tamburine Kimberly L | $239,400 | |
| Previous Owner | Tamburino Kimberly | $100,000 | |
| Previous Owner | Tamburino Kimberly | $68,000 |
Source: Public Records
Tax History Compared to Growth
Tax History
| Year | Tax Paid | Tax Assessment Tax Assessment Total Assessment is a certain percentage of the fair market value that is determined by local assessors to be the total taxable value of land and additions on the property. | Land | Improvement |
|---|---|---|---|---|
| 2024 | $4,636 | $370,900 | $104,700 | $266,200 |
| 2023 | $4,184 | $334,700 | $104,700 | $230,000 |
| 2022 | $3,873 | $309,800 | $84,000 | $225,800 |
| 2021 | $3,613 | $289,000 | $76,400 | $212,600 |
| 2020 | $3,459 | $276,700 | $66,100 | $210,600 |
| 2019 | $3,251 | $260,100 | $57,500 | $202,600 |
| 2018 | $3,083 | $246,600 | $57,500 | $189,100 |
| 2017 | $2,751 | $239,200 | $57,500 | $181,700 |
| 2016 | $2,751 | $243,000 | $57,500 | $185,500 |
| 2015 | $2,795 | $243,000 | $57,500 | $185,500 |
| 2014 | $2,795 | $243,000 | $57,500 | $185,500 |
Source: Public Records
Map
Nearby Homes
- 119 E Randall Ave
- 143 E Randall Ave
- 138 Lenox Ave
- 183 W Randall Ave
- 325 E Lorengo Ave
- 9254 Marlow Ave
- 9264 Buckman Ave
- 9263 Buckman Ave
- 414 E Randall Ave
- 184 Bearden Rd
- 9273 1st View St
- 9275 1st View St
- 128 E Westmont Ave
- 9215 1st View St
- 165 Commodore Dr
- 149 Cherry St
- 8812 Commodore Dr
- 9460 Granby St
- 9308 Hickory St
- 305 E Westmont Ave