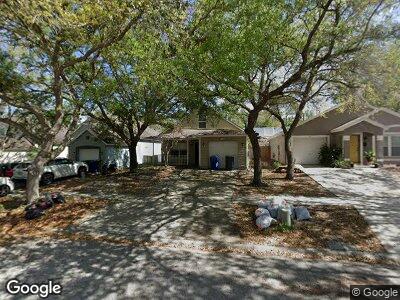
912 Cape Cod Cir Valrico, FL 33594
Estimated Value: $275,000 - $314,000
3
Beds
2
Baths
1,318
Sq Ft
$227/Sq Ft
Est. Value
About This Home
This home is located at 912 Cape Cod Cir, Valrico, FL 33594 and is currently estimated at $299,373, approximately $227 per square foot. 912 Cape Cod Cir is a home located in Hillsborough County with nearby schools including Nelson Elementary School, Mulrennan Middle School, and Durant High School.
Ownership History
Date
Name
Owned For
Owner Type
Purchase Details
Closed on
Dec 8, 2021
Sold by
Astor Fla Llc
Bought by
Gutenberg Fl Llc
Current Estimated Value
Purchase Details
Closed on
Apr 1, 2016
Bought by
Astor Fla Llc
Purchase Details
Closed on
Jul 7, 2015
Sold by
Randolph Cinda
Bought by
Astor Indy Llc
Purchase Details
Closed on
Nov 10, 2004
Sold by
Bachner Sharon E
Bought by
Randolph Cinda
Home Financials for this Owner
Home Financials are based on the most recent Mortgage that was taken out on this home.
Original Mortgage
$129,920
Interest Rate
5.77%
Mortgage Type
FHA
Purchase Details
Closed on
Jan 8, 1999
Sold by
Kbc Development Inc
Bought by
Bachner Sharon E
Home Financials for this Owner
Home Financials are based on the most recent Mortgage that was taken out on this home.
Original Mortgage
$81,050
Interest Rate
6.77%
Mortgage Type
New Conventional
Create a Home Valuation Report for This Property
The Home Valuation Report is an in-depth analysis detailing your home's value as well as a comparison with similar homes in the area
Home Values in the Area
Average Home Value in this Area
Purchase History
| Date | Buyer | Sale Price | Title Company |
|---|---|---|---|
| Gutenberg Fl Llc | $9,116,993 | Fidelity Natl Ttl Of Fl Inc | |
| Astor Fla Llc | $100 | -- | |
| Astor Indy Llc | $98,100 | Attorney | |
| Randolph Cinda | $135,000 | Fidelity Natl Title Ins Co | |
| Bachner Sharon E | $20,000 | -- |
Source: Public Records
Mortgage History
| Date | Status | Borrower | Loan Amount |
|---|---|---|---|
| Previous Owner | Randolph Cinda | $148,000 | |
| Previous Owner | Randolph Cinda | $18,500 | |
| Previous Owner | Randolph Cinda | $129,920 | |
| Previous Owner | Bachner Sharon E | $81,000 | |
| Previous Owner | Bachner Sharon E | $81,050 |
Source: Public Records
Tax History Compared to Growth
Tax History
| Year | Tax Paid | Tax Assessment Tax Assessment Total Assessment is a certain percentage of the fair market value that is determined by local assessors to be the total taxable value of land and additions on the property. | Land | Improvement |
|---|---|---|---|---|
| 2024 | $4,016 | $222,321 | $65,826 | $156,495 |
| 2023 | $4,016 | $194,299 | $57,240 | $137,059 |
| 2022 | $3,872 | $189,701 | $57,240 | $132,461 |
| 2021 | $3,035 | $143,741 | $40,068 | $103,673 |
| 2020 | $2,733 | $126,064 | $38,637 | $87,427 |
| 2019 | $2,961 | $124,900 | $40,068 | $84,832 |
| 2018 | $2,781 | $112,960 | $0 | $0 |
| 2017 | $2,670 | $106,039 | $0 | $0 |
| 2016 | $2,615 | $102,802 | $0 | $0 |
| 2015 | $1,336 | $74,998 | $0 | $0 |
| 2014 | $1,312 | $75,227 | $0 | $0 |
| 2013 | -- | $74,115 | $0 | $0 |
Source: Public Records
Map
Nearby Homes
- 414 Choo Ln
- 816 Cape Cod Cir
- 509 Choo Ln
- 416 S Mulrennan Rd
- 508 Klickety Klak Ln
- 413 Klickety Klak Ln Unit 549
- 414 Boxcar Way
- 252 Taho Cir Unit 252
- 505 Caboose Ln Unit 458
- 261 Taho Cir Unit 38
- 275 Taho Cir
- 409 Boxcar Way
- 253 Taho Cir
- 244 Taho Cir Unit 143
- 135 Pioneer Ln
- 315 Taho Cir Unit 21
- 138 Pioneer Ln Unit 138
- 607 Choo Ln Unit 607F
- 608 Klickety Klak Ln
- 754 Cape Cod Cir