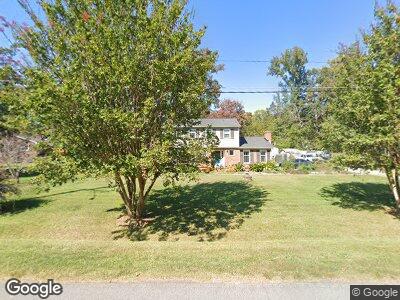
916 Martin Ave Graham, NC 27253
Estimated Value: $282,000 - $311,122
4
Beds
3
Baths
2,047
Sq Ft
$148/Sq Ft
Est. Value
About This Home
This home is located at 916 Martin Ave, Graham, NC 27253 and is currently estimated at $302,781, approximately $147 per square foot. 916 Martin Ave is a home located in Alamance County with nearby schools including South Graham Elementary School, Southern Middle School, and Southern High School.
Ownership History
Date
Name
Owned For
Owner Type
Purchase Details
Closed on
Jul 5, 2022
Sold by
Kimberly Fanning Joyce and Kimberly James
Bought by
Fanning Joyce Kimberly and Fanning Joyce Kimberly
Current Estimated Value
Home Financials for this Owner
Home Financials are based on the most recent Mortgage that was taken out on this home.
Original Mortgage
$90,000
Outstanding Balance
$78,387
Interest Rate
4.38%
Mortgage Type
New Conventional
Estimated Equity
$224,394
Purchase Details
Closed on
Mar 26, 2002
Sold by
Bayliff Henry L
Bought by
Bradley Mary P
Home Financials for this Owner
Home Financials are based on the most recent Mortgage that was taken out on this home.
Original Mortgage
$147,450
Interest Rate
6.85%
Mortgage Type
New Conventional
Purchase Details
Closed on
Feb 9, 1999
Sold by
Whitson Linda B
Bought by
Bayliff Henry L
Create a Home Valuation Report for This Property
The Home Valuation Report is an in-depth analysis detailing your home's value as well as a comparison with similar homes in the area
Home Values in the Area
Average Home Value in this Area
Purchase History
| Date | Buyer | Sale Price | Title Company |
|---|---|---|---|
| Fanning Joyce Kimberly | -- | Rosenberg Jay A | |
| Bradley Mary P | $150,000 | -- | |
| Bayliff Henry L | -- | -- |
Source: Public Records
Mortgage History
| Date | Status | Borrower | Loan Amount |
|---|---|---|---|
| Open | Fanning Joyce Kimberly | $90,000 | |
| Previous Owner | Fanning Joyce K | $106,900 | |
| Previous Owner | Fanning Joyce | $120,750 | |
| Previous Owner | Bradley Mary P | $147,450 |
Source: Public Records
Tax History Compared to Growth
Tax History
| Year | Tax Paid | Tax Assessment Tax Assessment Total Assessment is a certain percentage of the fair market value that is determined by local assessors to be the total taxable value of land and additions on the property. | Land | Improvement |
|---|---|---|---|---|
| 2024 | $1,239 | $264,183 | $33,374 | $230,809 |
| 2023 | $1,365 | $317,498 | $33,374 | $284,124 |
| 2022 | $1,628 | $147,782 | $27,912 | $119,870 |
| 2021 | $1,643 | $147,782 | $27,912 | $119,870 |
| 2020 | $1,658 | $147,782 | $27,912 | $119,870 |
| 2019 | $1,663 | $147,782 | $27,912 | $119,870 |
| 2018 | $0 | $147,782 | $27,912 | $119,870 |
| 2017 | $1,530 | $147,782 | $27,912 | $119,870 |
| 2016 | $1,565 | $151,206 | $27,912 | $123,294 |
| 2015 | $873 | $151,206 | $27,912 | $123,294 |
| 2014 | $797 | $151,206 | $27,912 | $123,294 |
Source: Public Records
Map
Nearby Homes
- 2902 Cullens Dr
- 1844 Brier Ln
- 1977 Swepsonville Rd
- 1350 Geneva Albright Rd
- 1009 Haynoke Dr
- 2385 Olde Spring Ct
- 1100 Reatkin Ln
- 633 Starfall Rd
- 649 Starfall Rd
- 600 Starfall Rd
- 665 Starfall Rd
- 616 Starfall Rd
- 681 Starfall Rd
- 217 Braeburn Dr
- 632 Starfall Rd
- 701 Starfall Rd
- 650 Starfall Rd
- 664 Starfall Rd
- 2532 Trevana Way
- 682 Starfall Rd