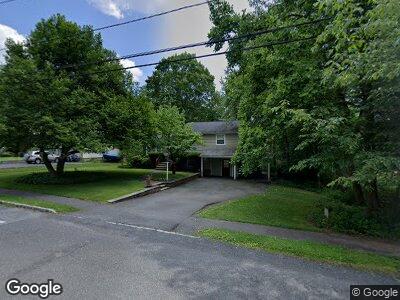
92 Brookdale Rd Watchung, NJ 07069
Watchung NeighborhoodEstimated Value: $663,000 - $756,000
3
Beds
2
Baths
1,482
Sq Ft
$481/Sq Ft
Est. Value
About This Home
This home is located at 92 Brookdale Rd, Watchung, NJ 07069 and is currently estimated at $712,863, approximately $481 per square foot. 92 Brookdale Rd is a home located in Somerset County with nearby schools including Bayberry Elementary School, Valley View School, and Watchung Hills Regional High School.
Ownership History
Date
Name
Owned For
Owner Type
Purchase Details
Closed on
Mar 24, 2004
Sold by
Kempson Jason D
Bought by
Jasapara Jayesh C and Jasapara Padmini J
Current Estimated Value
Purchase Details
Closed on
Sep 28, 2000
Sold by
Nelson Wayne
Bought by
Kempson Jason and Kempson Kathryn
Home Financials for this Owner
Home Financials are based on the most recent Mortgage that was taken out on this home.
Original Mortgage
$110,000
Interest Rate
7.94%
Create a Home Valuation Report for This Property
The Home Valuation Report is an in-depth analysis detailing your home's value as well as a comparison with similar homes in the area
Home Values in the Area
Average Home Value in this Area
Purchase History
| Date | Buyer | Sale Price | Title Company |
|---|---|---|---|
| Jasapara Jayesh C | $408,000 | -- | |
| Kempson Jason | $256,000 | -- |
Source: Public Records
Mortgage History
| Date | Status | Borrower | Loan Amount |
|---|---|---|---|
| Open | Jasapara Jayesh C | $210,000 | |
| Previous Owner | Kempson Jason | $110,000 |
Source: Public Records
Tax History Compared to Growth
Tax History
| Year | Tax Paid | Tax Assessment Tax Assessment Total Assessment is a certain percentage of the fair market value that is determined by local assessors to be the total taxable value of land and additions on the property. | Land | Improvement |
|---|---|---|---|---|
| 2024 | $10,595 | $530,300 | $332,900 | $197,400 |
| 2023 | $9,991 | $489,500 | $311,100 | $178,400 |
| 2022 | $9,509 | $452,600 | $280,200 | $172,400 |
| 2021 | $9,155 | $438,100 | $272,000 | $166,100 |
| 2020 | $9,465 | $444,800 | $281,100 | $163,700 |
| 2019 | $9,155 | $441,200 | $281,100 | $160,100 |
| 2018 | $8,679 | $435,900 | $278,200 | $157,700 |
| 2017 | $8,435 | $426,200 | $262,500 | $163,700 |
| 2016 | $8,799 | $420,800 | $262,500 | $158,300 |
| 2015 | $8,544 | $403,400 | $249,900 | $153,500 |
| 2014 | $8,238 | $393,400 | $244,700 | $148,700 |
Source: Public Records
Map
Nearby Homes