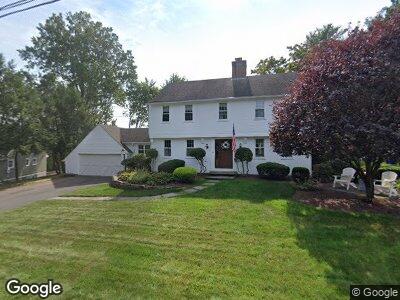
92 Spring Ln West Hartford, CT 06107
Estimated Value: $637,047 - $742,000
4
Beds
3
Baths
1,956
Sq Ft
$351/Sq Ft
Est. Value
About This Home
This home is located at 92 Spring Ln, West Hartford, CT 06107 and is currently estimated at $686,512, approximately $350 per square foot. 92 Spring Ln is a home located in Hartford County with nearby schools including Duffy School, Sedgwick Middle School, and Conard High School.
Ownership History
Date
Name
Owned For
Owner Type
Purchase Details
Closed on
Aug 1, 2007
Sold by
Girard Christopher F and Girard Kathryn M
Bought by
Humiston David and Humiston Corrine
Current Estimated Value
Home Financials for this Owner
Home Financials are based on the most recent Mortgage that was taken out on this home.
Original Mortgage
$110,000
Interest Rate
6.73%
Purchase Details
Closed on
May 17, 2005
Sold by
Beach Deborah E
Bought by
Girard Christopher F
Home Financials for this Owner
Home Financials are based on the most recent Mortgage that was taken out on this home.
Original Mortgage
$282,000
Interest Rate
6.12%
Purchase Details
Closed on
Jan 12, 2001
Sold by
Ashcraft Robert E
Bought by
Beach Deborah E
Create a Home Valuation Report for This Property
The Home Valuation Report is an in-depth analysis detailing your home's value as well as a comparison with similar homes in the area
Home Values in the Area
Average Home Value in this Area
Purchase History
| Date | Buyer | Sale Price | Title Company |
|---|---|---|---|
| Humiston David | $403,000 | -- | |
| Girard Christopher F | $382,000 | -- | |
| Beach Deborah E | $250,000 | -- |
Source: Public Records
Mortgage History
| Date | Status | Borrower | Loan Amount |
|---|---|---|---|
| Open | Humiston David | $250,000 | |
| Closed | Humiston David | $148,000 | |
| Closed | Humiston David | $109,000 | |
| Closed | Beach Deborah E | $148,000 | |
| Closed | Beach Deborah E | $111,000 | |
| Closed | Beach Deborah E | $110,000 | |
| Previous Owner | Beach Deborah E | $282,000 |
Source: Public Records
Tax History Compared to Growth
Tax History
| Year | Tax Paid | Tax Assessment Tax Assessment Total Assessment is a certain percentage of the fair market value that is determined by local assessors to be the total taxable value of land and additions on the property. | Land | Improvement |
|---|---|---|---|---|
| 2024 | $12,801 | $302,260 | $112,700 | $189,560 |
| 2023 | $12,368 | $302,260 | $112,700 | $189,560 |
| 2022 | $12,296 | $302,260 | $112,700 | $189,560 |
| 2021 | $11,462 | $270,200 | $115,990 | $154,210 |
| 2020 | $10,814 | $258,720 | $108,570 | $150,150 |
| 2019 | $10,814 | $258,720 | $108,570 | $150,150 |
| 2018 | $10,608 | $258,720 | $108,570 | $150,150 |
| 2017 | $10,618 | $258,720 | $108,570 | $150,150 |
| 2016 | $10,363 | $262,290 | $91,210 | $171,080 |
| 2015 | $10,048 | $262,290 | $91,210 | $171,080 |
| 2014 | $9,802 | $262,290 | $91,210 | $171,080 |
Source: Public Records
Map
Nearby Homes
- 15 Chapman Rd
- 110 Ridgewood Rd
- 79 Pheasant Hill Dr
- 175 Garfield Rd
- 253 S Main St
- 210 Sedgwick Rd
- 50 Briarwood Rd
- 51 Briarwood Rd
- 281 Westpoint Terrace
- 184 S Main St
- 140 Westland Ave
- 90 Bentwood Rd
- 46 Sedgwick Rd
- 8 Woodruff Rd
- 51 Shadow Ln
- 53 Shadow Ln
- 18 Eastview St
- 117 Shadow Ln Unit B2
- 15 Finger Ln
- 14 Chamberlin Dr