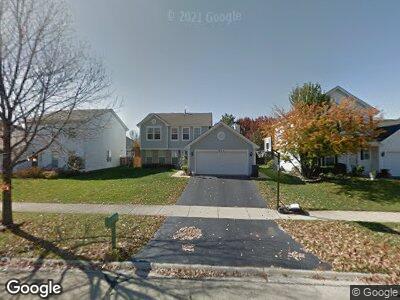
923 Matthew Ct Naperville, IL 60540
West Sanctuary Lane NeighborhoodEstimated Value: $444,000 - $505,000
3
Beds
3
Baths
1,820
Sq Ft
$259/Sq Ft
Est. Value
About This Home
This home is located at 923 Matthew Ct, Naperville, IL 60540 and is currently estimated at $471,162, approximately $258 per square foot. 923 Matthew Ct is a home located in DuPage County with nearby schools including Mary Lou Cowlishaw Elementary School, Still Middle School, and Metea Valley High School.
Ownership History
Date
Name
Owned For
Owner Type
Purchase Details
Closed on
Apr 23, 2021
Sold by
Sohail Syed Tariq and Sohail Talat
Bought by
Sohail Syed Tariq and Sohail Talat
Current Estimated Value
Purchase Details
Closed on
Dec 20, 2002
Sold by
Benedict Ronald L and Benedict Rosalie A
Bought by
Sohail Syed Tariq
Home Financials for this Owner
Home Financials are based on the most recent Mortgage that was taken out on this home.
Original Mortgage
$198,000
Interest Rate
5.75%
Purchase Details
Closed on
Dec 4, 1997
Sold by
Hepburn Eric R and Hepburn Katherine E
Bought by
Benedict Ronald L and Benedict Rosalie A
Purchase Details
Closed on
Dec 5, 1995
Sold by
Lakewood Crossing Ltd Partnership Ph 3
Bought by
Hepburn Eric R and Hepburn Katherine E
Home Financials for this Owner
Home Financials are based on the most recent Mortgage that was taken out on this home.
Original Mortgage
$160,000
Interest Rate
7.43%
Create a Home Valuation Report for This Property
The Home Valuation Report is an in-depth analysis detailing your home's value as well as a comparison with similar homes in the area
Home Values in the Area
Average Home Value in this Area
Purchase History
| Date | Buyer | Sale Price | Title Company |
|---|---|---|---|
| Sohail Syed Tariq | -- | Attorney | |
| Sohail Syed Tariq | $220,000 | Ctic | |
| Benedict Ronald L | $185,000 | -- | |
| Hepburn Eric R | $173,500 | First American Title |
Source: Public Records
Mortgage History
| Date | Status | Borrower | Loan Amount |
|---|---|---|---|
| Open | Sohail Syed Tariq | $225,000 | |
| Closed | Sohail Syed Tariq | $154,500 | |
| Closed | Sohail Syed Tariq | $167,000 | |
| Closed | Sohail Syed Tariq | $171,500 | |
| Closed | Sohail Syed Tariq | $185,000 | |
| Closed | Sohail Syed Tariq | $185,000 | |
| Closed | Sohail Syed Tariq | $190,000 | |
| Closed | Sohail Syed Tariq | $196,000 | |
| Closed | Sohail Syed Tariq | $198,000 | |
| Previous Owner | Hepburn Eric R | $160,000 |
Source: Public Records
Tax History Compared to Growth
Tax History
| Year | Tax Paid | Tax Assessment Tax Assessment Total Assessment is a certain percentage of the fair market value that is determined by local assessors to be the total taxable value of land and additions on the property. | Land | Improvement |
|---|---|---|---|---|
| 2023 | $5,586 | $122,430 | $40,510 | $81,920 |
| 2022 | $6,052 | $115,070 | $37,800 | $77,270 |
| 2021 | $6,087 | $110,960 | $36,450 | $74,510 |
| 2020 | $6,078 | $110,960 | $36,450 | $74,510 |
| 2019 | $6,152 | $105,540 | $34,670 | $70,870 |
| 2018 | $6,622 | $99,550 | $32,480 | $67,070 |
| 2017 | $6,436 | $96,180 | $31,380 | $64,800 |
| 2016 | $6,313 | $92,300 | $30,110 | $62,190 |
| 2015 | $6,247 | $87,640 | $28,590 | $59,050 |
| 2014 | $6,116 | $83,160 | $26,940 | $56,220 |
| 2013 | $6,104 | $83,740 | $27,130 | $56,610 |
Source: Public Records
Map
Nearby Homes
- 2135 Schumacher Dr
- 2008 Chang Ct
- 2539 Lexington Ln
- 864 Shandrew Dr Unit 402
- 828 Sanctuary Ln
- 691 Wintergreen Cir
- 1280 Arapaho Ct
- 2589 Arcadia Cir Unit 156
- 2933 Henley Ln
- 1323 Ada Ln
- 1284 Tennyson Ln Unit 2
- 1299 Tennyson Ln
- 1266 Rhodes Ln Unit 2703
- 9S110 Chandelle Dr
- 1209 Ardmore Dr
- 971 Heathrow Ln
- 960 Heathrow Ln
- 621 Joshua Ct
- 1138 Tennyson Ln
- 459 Plaza Place