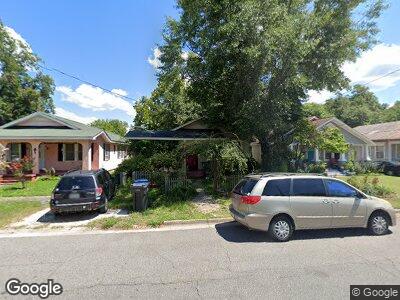
924 Merry St Augusta, GA 30904
Midtown Augusta NeighborhoodEstimated Value: $145,000 - $160,000
2
Beds
1
Bath
1,160
Sq Ft
$132/Sq Ft
Est. Value
About This Home
This home is located at 924 Merry St, Augusta, GA 30904 and is currently estimated at $153,516, approximately $132 per square foot. 924 Merry St is a home located in Richmond County with nearby schools including Monte Sano Elementary School, Johnson Magnet, and Langford Middle School.
Ownership History
Date
Name
Owned For
Owner Type
Purchase Details
Closed on
Jun 24, 2008
Sold by
Jones Clarence R and Jones Caroline D
Bought by
Gonzalez Joshua and Venable Alan J
Current Estimated Value
Home Financials for this Owner
Home Financials are based on the most recent Mortgage that was taken out on this home.
Original Mortgage
$85,200
Outstanding Balance
$57,069
Interest Rate
6.08%
Mortgage Type
FHA
Estimated Equity
$107,016
Purchase Details
Closed on
Feb 20, 2004
Sold by
Wilson James C and Wilson Sheron E
Bought by
Jones Clarence R and Jones Caroline D
Home Financials for this Owner
Home Financials are based on the most recent Mortgage that was taken out on this home.
Original Mortgage
$54,900
Interest Rate
5.87%
Mortgage Type
Purchase Money Mortgage
Purchase Details
Closed on
Apr 5, 1996
Sold by
Parkman Patricia D
Bought by
Holland James
Purchase Details
Closed on
Jun 1, 1989
Sold by
Clary George E
Bought by
Parkman Patricia D
Purchase Details
Closed on
May 1, 1981
Create a Home Valuation Report for This Property
The Home Valuation Report is an in-depth analysis detailing your home's value as well as a comparison with similar homes in the area
Home Values in the Area
Average Home Value in this Area
Purchase History
| Date | Buyer | Sale Price | Title Company |
|---|---|---|---|
| Gonzalez Joshua | $86,600 | None Available | |
| Jones Clarence R | $61,000 | -- | |
| Holland James | $51,500 | -- | |
| Parkman Patricia D | $39,500 | -- |
Source: Public Records
Mortgage History
| Date | Status | Borrower | Loan Amount |
|---|---|---|---|
| Open | Gonzalez Joshua | $85,200 | |
| Previous Owner | Jones Clarence R | $54,900 | |
| Previous Owner | Wilson James C | $55,000 |
Source: Public Records
Tax History Compared to Growth
Tax History
| Year | Tax Paid | Tax Assessment Tax Assessment Total Assessment is a certain percentage of the fair market value that is determined by local assessors to be the total taxable value of land and additions on the property. | Land | Improvement |
|---|---|---|---|---|
| 2024 | $2,010 | $58,580 | $5,760 | $52,820 |
| 2023 | $2,010 | $57,772 | $5,760 | $52,012 |
| 2022 | $1,395 | $35,471 | $5,760 | $29,711 |
| 2021 | $1,309 | $29,727 | $5,760 | $23,967 |
| 2020 | $1,220 | $27,548 | $5,760 | $21,788 |
| 2019 | $1,285 | $27,522 | $5,760 | $21,762 |
| 2018 | $1,294 | $27,522 | $5,760 | $21,762 |
| 2017 | $1,288 | $27,522 | $5,760 | $21,762 |
| 2016 | $1,289 | $27,522 | $5,760 | $21,762 |
| 2015 | $1,346 | $27,522 | $5,760 | $21,762 |
| 2014 | $1,297 | $27,522 | $5,760 | $21,762 |
Source: Public Records
Map
Nearby Homes
- 934 Murphy St
- 1826 Howard Ave
- 1004 Murphy St
- 930 Holden Dr
- 1910 Warren St
- 1930 Warren St
- 1128 Murphy St
- 1835 Starnes St
- 1915 Hampton Ave
- 1210 Murphy St
- 1815 Fenwick St
- 1919 Hampton Ave
- 1921 Fenwick St
- 642 Crawford Ave
- 2015 Starnes St
- 1006 Russell St
- 1917 Mcdowell St
- 2092 Heckle St
- 1825 Watkins St
- 622 Crawford Ave