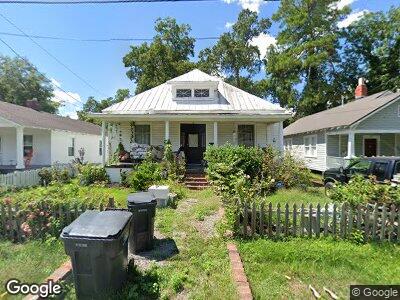
927 Merry St Augusta, GA 30904
Midtown Augusta NeighborhoodEstimated Value: $174,000 - $228,000
3
Beds
2
Baths
1,965
Sq Ft
$105/Sq Ft
Est. Value
About This Home
This home is located at 927 Merry St, Augusta, GA 30904 and is currently estimated at $206,046, approximately $104 per square foot. 927 Merry St is a home located in Richmond County with nearby schools including Monte Sano Elementary School, Johnson Magnet, and Langford Middle School.
Ownership History
Date
Name
Owned For
Owner Type
Purchase Details
Closed on
Jun 25, 2010
Sold by
Cwalt Inc Trust 2006-2Cb
Bought by
Dargin Charles F
Current Estimated Value
Purchase Details
Closed on
Mar 2, 2010
Sold by
Underwood Samuel
Bought by
Cwalt Inc Trust 2006-2Cb
Purchase Details
Closed on
Oct 18, 2005
Sold by
Feuerhahn Chad M
Bought by
Underwood Samuel
Home Financials for this Owner
Home Financials are based on the most recent Mortgage that was taken out on this home.
Original Mortgage
$115,000
Interest Rate
5.66%
Mortgage Type
Purchase Money Mortgage
Purchase Details
Closed on
Jul 28, 2004
Sold by
Smith Jack P and Smith Charlotte K
Bought by
Feuerhahn Chad M
Purchase Details
Closed on
Jan 12, 2001
Sold by
Smith Charlotte Jones and Jones Sara Ashmore
Bought by
Smith Charlotte Jones
Create a Home Valuation Report for This Property
The Home Valuation Report is an in-depth analysis detailing your home's value as well as a comparison with similar homes in the area
Home Values in the Area
Average Home Value in this Area
Purchase History
| Date | Buyer | Sale Price | Title Company |
|---|---|---|---|
| Dargin Charles F | $40,000 | -- | |
| Cwalt Inc Trust 2006-2Cb | -- | -- | |
| Underwood Samuel | $115,000 | -- | |
| Feuerhahn Chad M | $20,000 | -- | |
| Smith Charlotte Jones | -- | -- |
Source: Public Records
Mortgage History
| Date | Status | Borrower | Loan Amount |
|---|---|---|---|
| Previous Owner | Underwood Samuel | $125,500 | |
| Previous Owner | Underwood Samuel | $115,000 | |
| Previous Owner | Feuerhahn Chad | $30,000 |
Source: Public Records
Tax History Compared to Growth
Tax History
| Year | Tax Paid | Tax Assessment Tax Assessment Total Assessment is a certain percentage of the fair market value that is determined by local assessors to be the total taxable value of land and additions on the property. | Land | Improvement |
|---|---|---|---|---|
| 2024 | $2,006 | $63,408 | $5,760 | $57,648 |
| 2023 | $2,006 | $87,416 | $5,760 | $81,656 |
| 2022 | $1,845 | $55,181 | $5,760 | $49,421 |
| 2021 | $1,865 | $46,295 | $5,760 | $40,535 |
| 2020 | $1,718 | $42,610 | $5,760 | $36,850 |
| 2019 | $1,819 | $42,610 | $5,760 | $36,850 |
| 2018 | $1,833 | $42,610 | $5,760 | $36,850 |
| 2017 | $1,824 | $42,610 | $5,760 | $36,850 |
| 2016 | $1,825 | $42,610 | $5,760 | $36,850 |
| 2015 | $1,836 | $42,610 | $5,760 | $36,850 |
| 2014 | $1,838 | $42,610 | $5,760 | $36,850 |
Source: Public Records
Map
Nearby Homes
- 934 Murphy St
- 1004 Murphy St
- 1826 Howard Ave
- 930 Holden Dr
- 1910 Warren St
- 1930 Warren St
- 1128 Murphy St
- 1835 Starnes St
- 1915 Hampton Ave
- 1919 Hampton Ave
- 1210 Murphy St
- 1815 Fenwick St
- 1921 Fenwick St
- 1006 Russell St
- 2092 Heckle St
- 1917 Mcdowell St
- 2015 Starnes St
- 2016 Hampton Ave
- 642 Crawford Ave
- 1905 Central Ave